Trajectory Graph
Steps
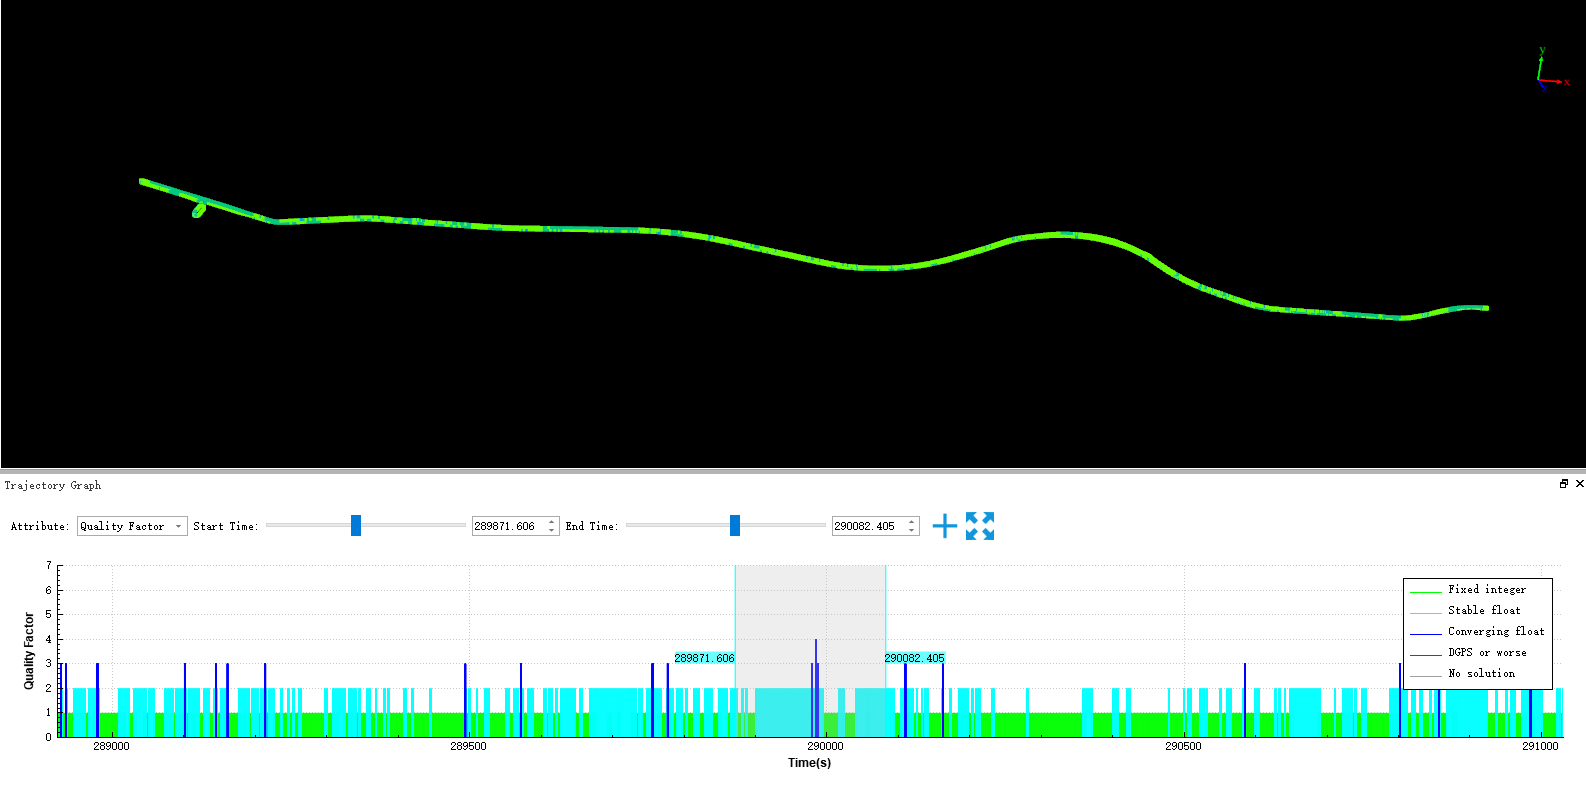
1.Click Trajectory Graph ![]() button, a chart will pop up at the bottom of the user interface to display the track map, the track map shows the track segmentation information at each time. Through the track map menu bar, you can adjust the display properties, add track segments, and change the track display range.
button, a chart will pop up at the bottom of the user interface to display the track map, the track map shows the track segmentation information at each time. Through the track map menu bar, you can adjust the display properties, add track segments, and change the track display range.

2.Adjust Display Properties: Click the selection box after the Attribute tab to adjust the information displayed in the segmented status chart. You can choose to display by Height, display by Quality Factor, display by Roll and Pitch, display by Heading, and display by Velocity.
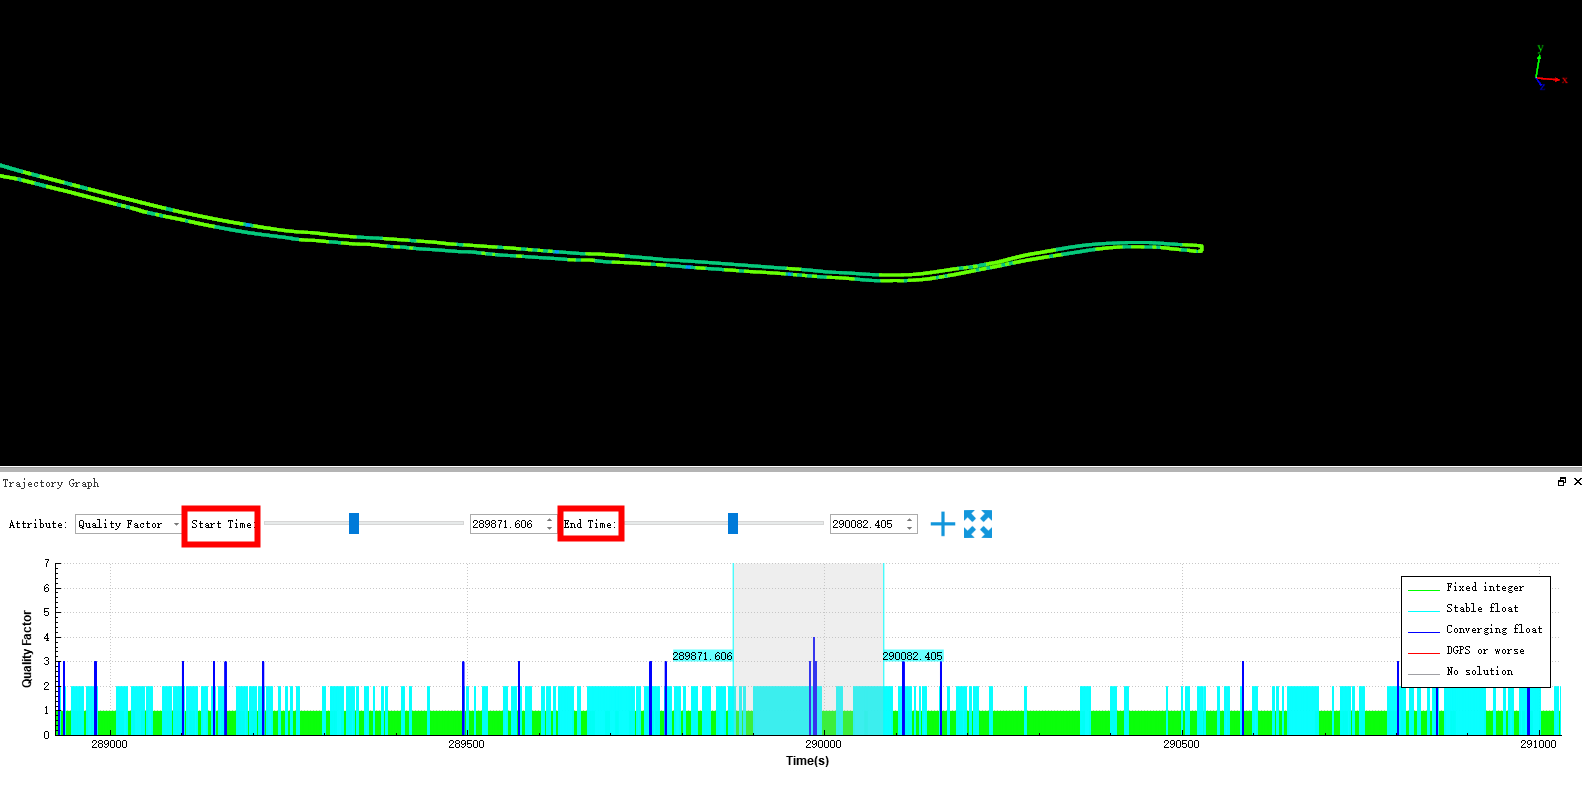
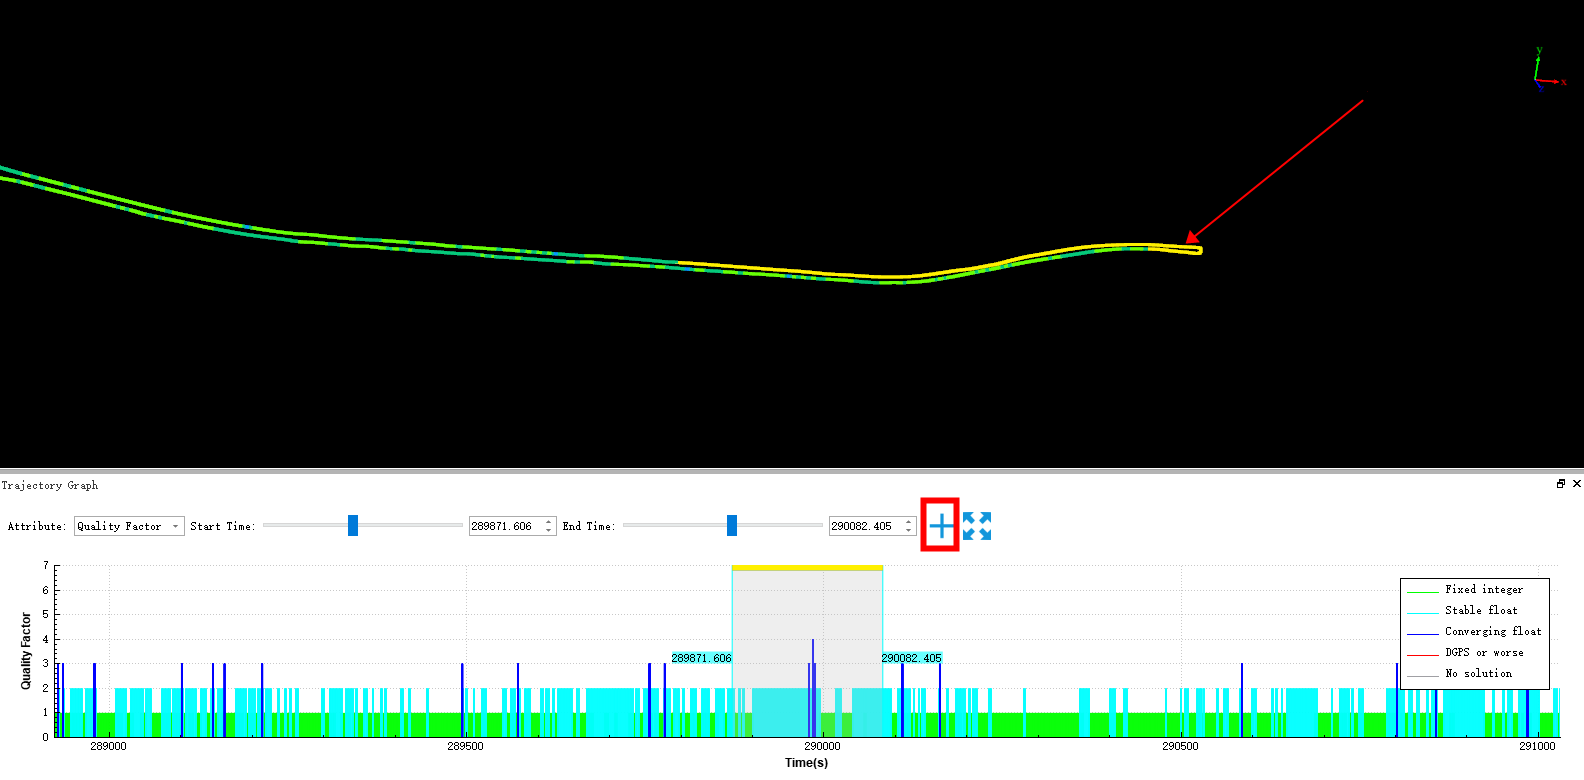
3.Add Segment: First click the scroll bar after the Start Time to select the start time of the track segment, then click the scroll bar after the End Time to select the end time of the track segment, and finally click Add Segment ![]() button completes the addition of the track segment.
button completes the addition of the track segment.

Select the start and end time

Add track segment
4.Change the Display Range of the Trajectory Graph: The trajectory graph displays the track segmentation information at all times by default. Use the mouse wheel to slide up and down on the track map to zoom in and out of the display range of the track map, click Full Extent ![]() button to restore the default display.
button to restore the default display.