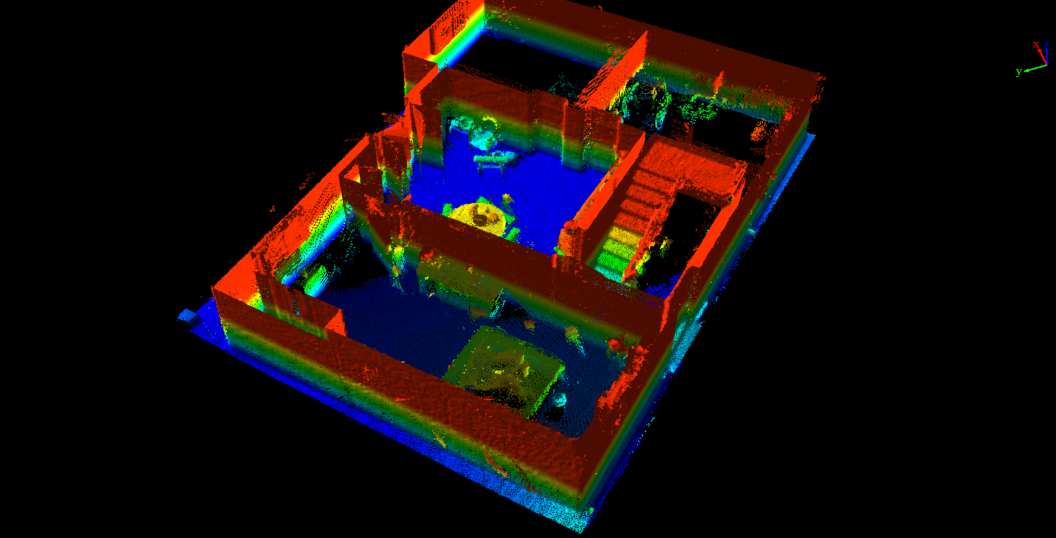
Display Mode
Single Attribute Display
1.Display by Height: For specific display effects, see Display by Height.
2.Display by Intensity: For specific display effects, see Display by Intensity.
3.Display by Blend: It can be used for point cloud data display. Integrating the height and intensity attributes of the point cloud data, map them to a uniformly changing color interval. It helps display the comprehensive change of point cloud data elevation and intensity more intuitively and display the categories and boundaries of ground objects more clearly.
4.Display by Classification: For specific display effects, see Display by Classification.
5.Display by RGB: For specific display effects, see Display by RGB.
6.Display by Return: For specific display effects, see Display by Return Num.
7.Display by Number of Return: Can be used for point cloud data display, mapping the last return count attribute of the point cloud data to the point cloud data.
7.1 Click the dropdown box of the Return Number to pop up the display dialog box by number of return.
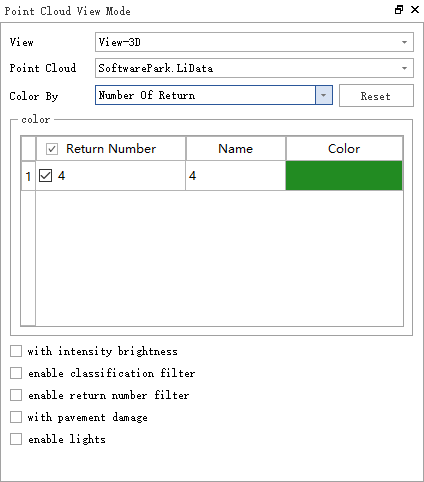
7.2 You can modify the display color and the effect which is better with EDL display, as shown in the figure.
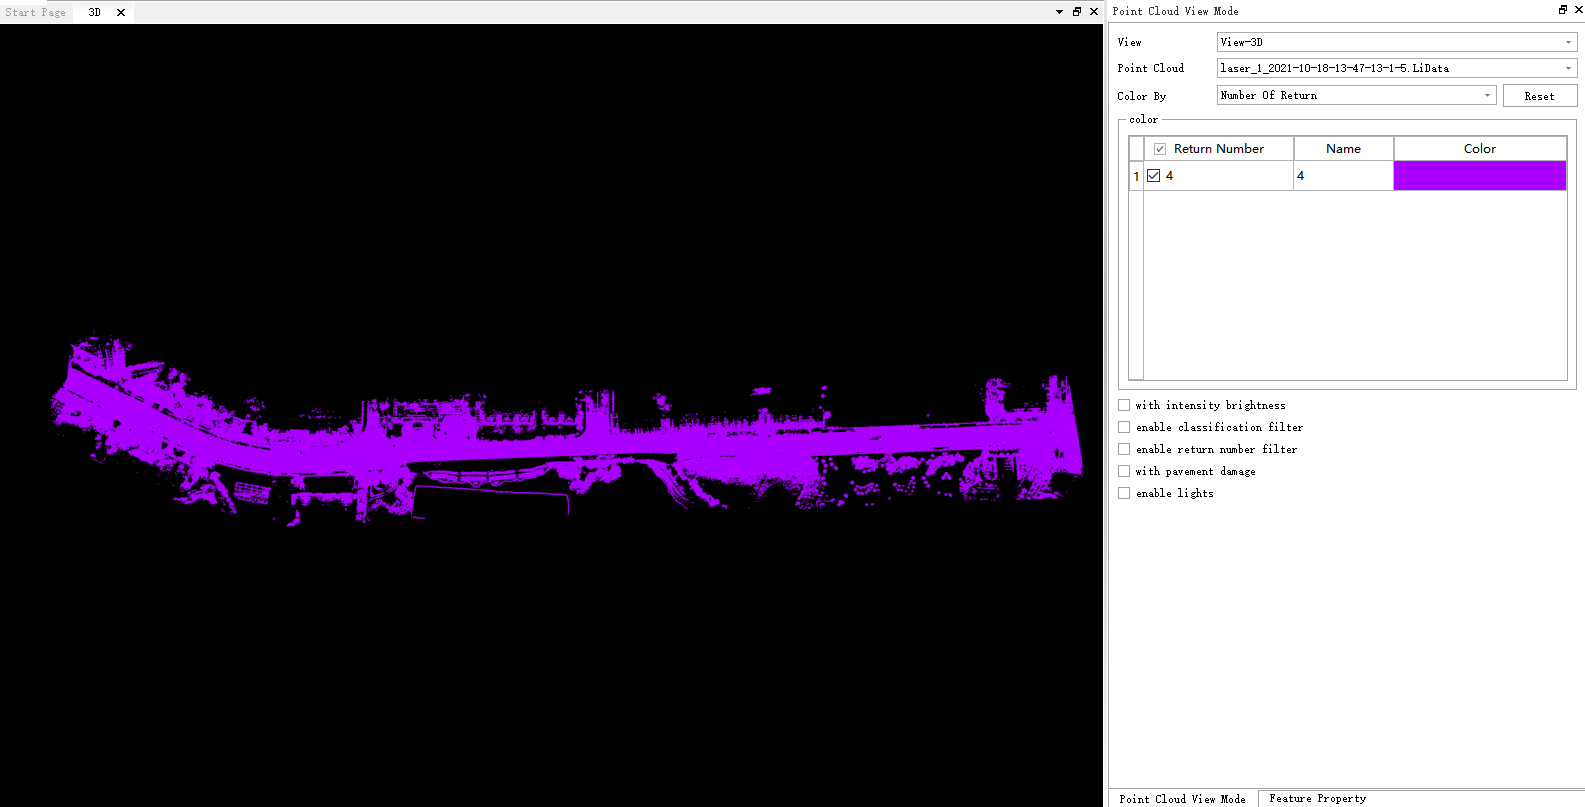
8.Display by GPS Time: For specific display effects, see Display by Time.
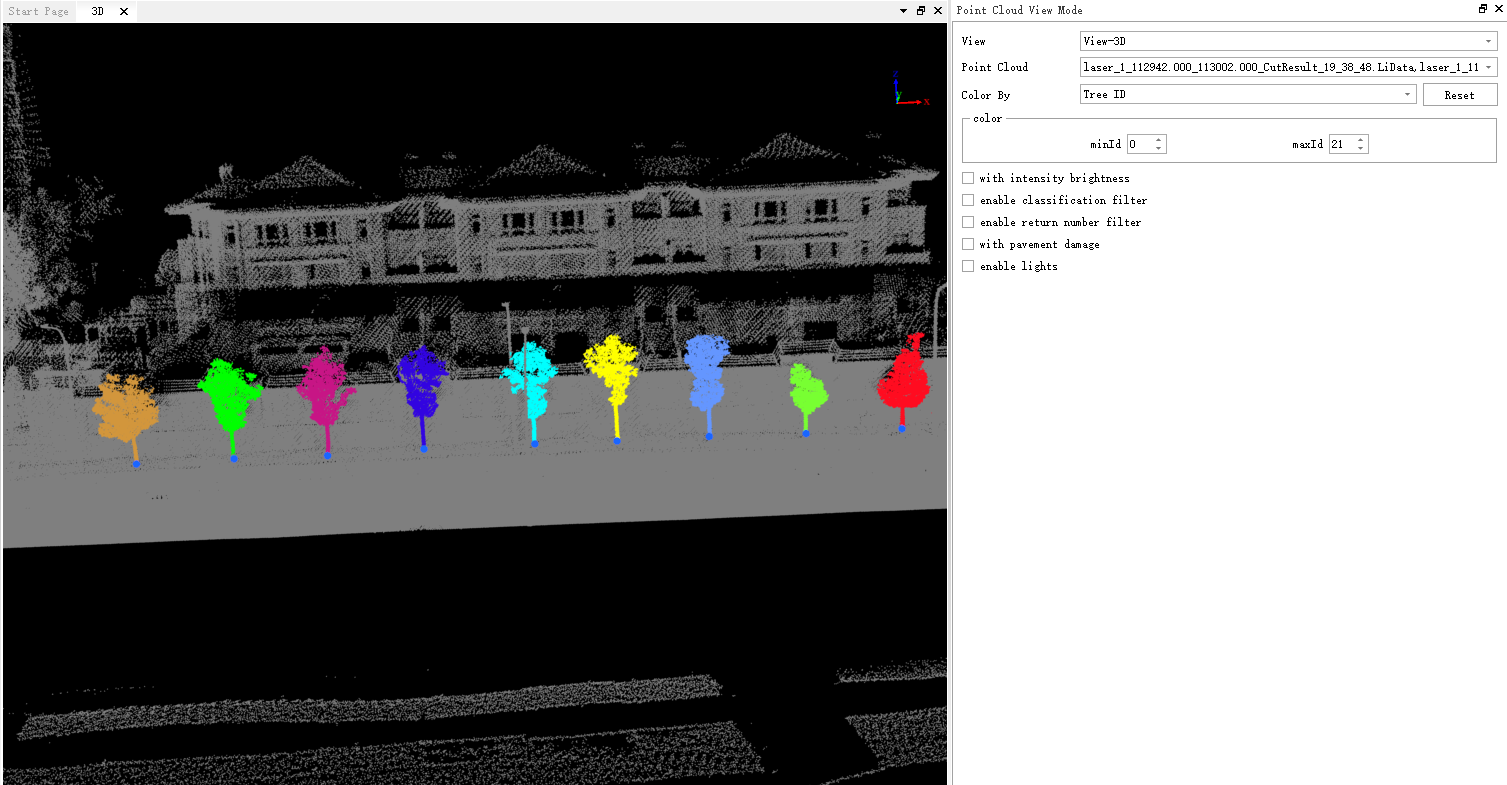
9.Display by Tree ID: Can be used for the display of point cloud data, mapping the tree ID attribute of the point cloud data to different color values, more intuitively distinguishing point cloud data of different tree IDs.
You can choose to display the minimum and maximum ID of the tree ID.
10.Display by Edge of Flight Line: If the point cloud data records Edge of Flight Line information, it can be displayed and rendered according to this attribute.
11.Display by Point Source ID: If the point cloud data records Point Source ID, it can be displayed and rendered according to this attribute.
12.Display by Scan Angle Rank: If the point cloud data records the Scan Angle attribute, it can be displayed and rendered according to this attribute.
13.Display by Scan Direction: If the point cloud data records Scan Direction information, it can be displayed and rendered according to this attribute.
14.Display by Scan Channel: If the point cloud data records Scan Channel information, it can be displayed and rendered according to this attribute.
15.Display by Near Infrared: If the point cloud data records Near Infrared information, it can be displayed and rendered according to this attribute.
16.Display by User Data: Can be used for the display of point cloud data, mapping the user data attribute of the point cloud data to different color values, more intuitively distinguishing point cloud data of different user data.
17.Display by Selected: Select a color in the color dialog box, and then display the Selected point cloud data in a uniform color.
18.Display by File: Each point cloud data is colored by one color, showing the multi-point cloud connections.
19.Display by Additional Attribute Cycle: If there are additional attributes in the point cloud data, as shown below, there is a single feature ID (PoleID). You can display the color cyclically according to a certain additional attribute value. The display effect is similar to the TreeID display effect.
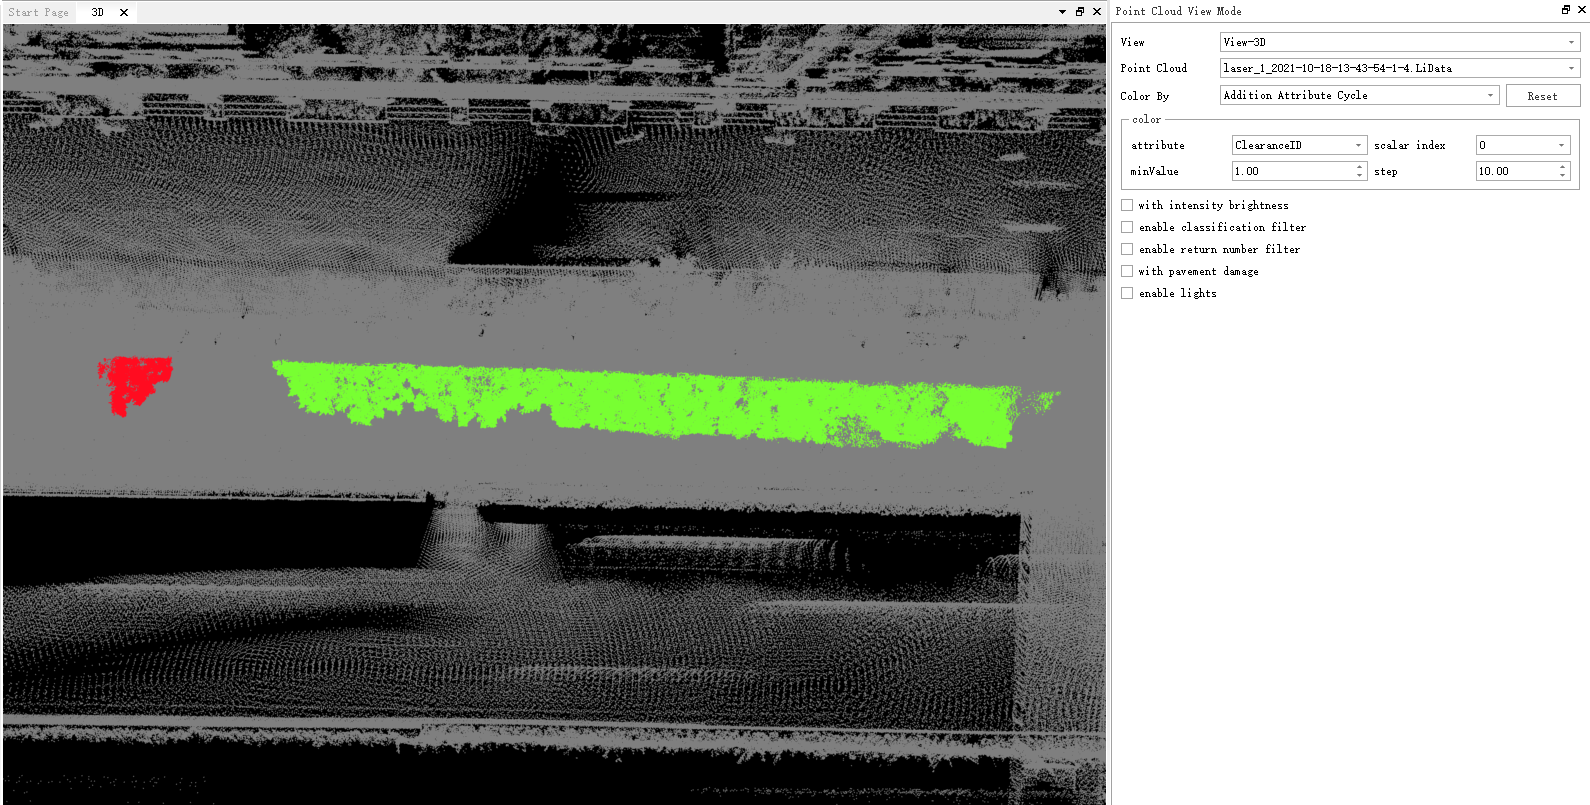
20.Display by Additional Attribute: If there are additional attributes in the point cloud data, you can set a color bar to stretch and render according to a certain additional attribute value.
Multi-View Display
1.The same point cloud can be displayed in different windows with different colors.
2.Click Point Cloud Color Mode---Viewport to select the color display mode of different windows.

3.Display effect:
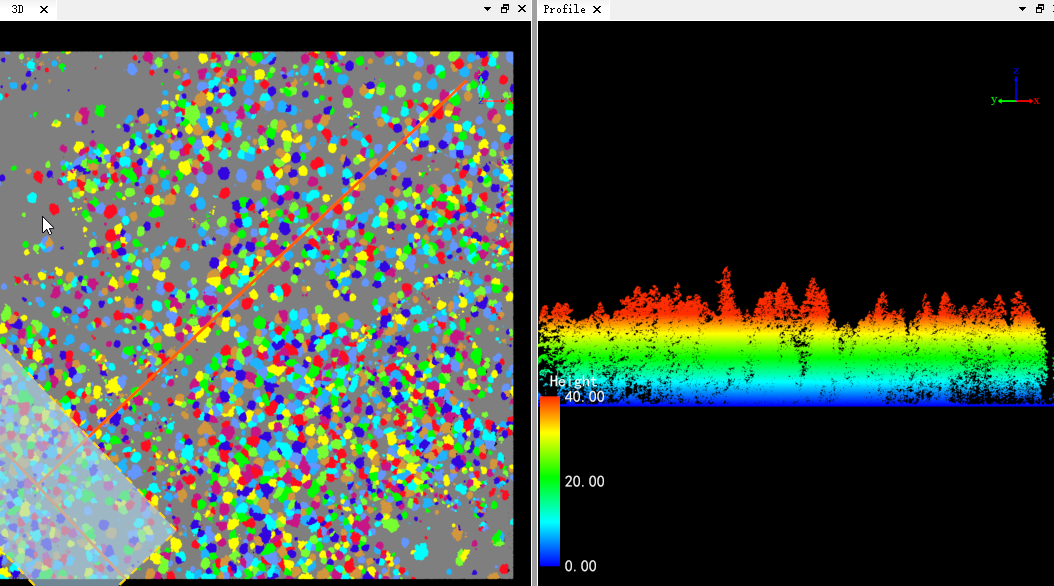
3D window is displayed by Tree ID, and the cross-section is displayed by height.
Saving and Resetting Display Parameters
After setting the color of the point cloud, the corresponding display parameters will be recorded. When switching back from other color modes, the previously set parameters will be used for displaying. If you want to restore to the default state, click the Reset button.
Multi-Attribute Combination Display
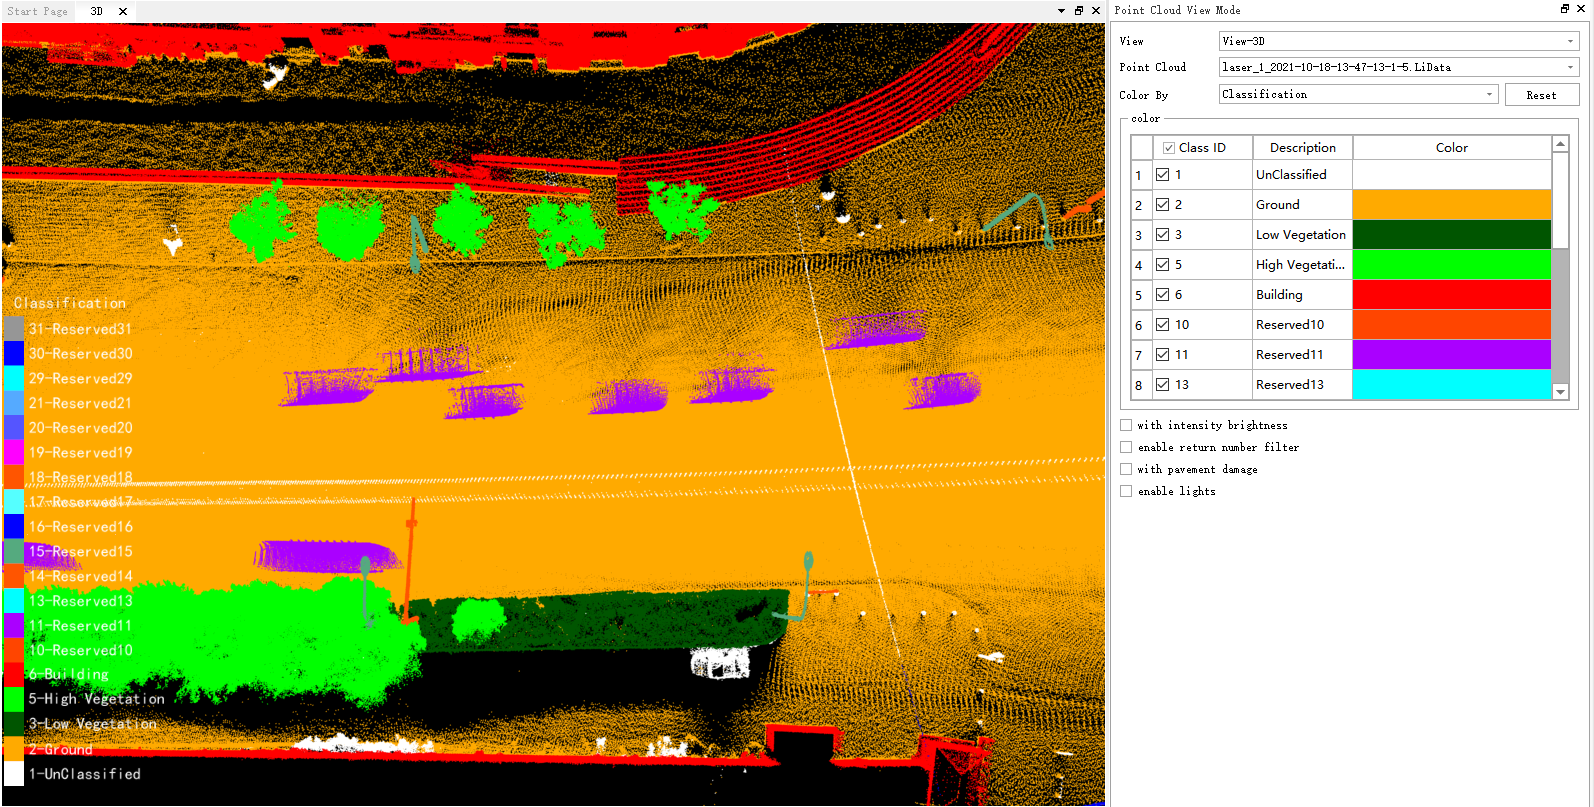
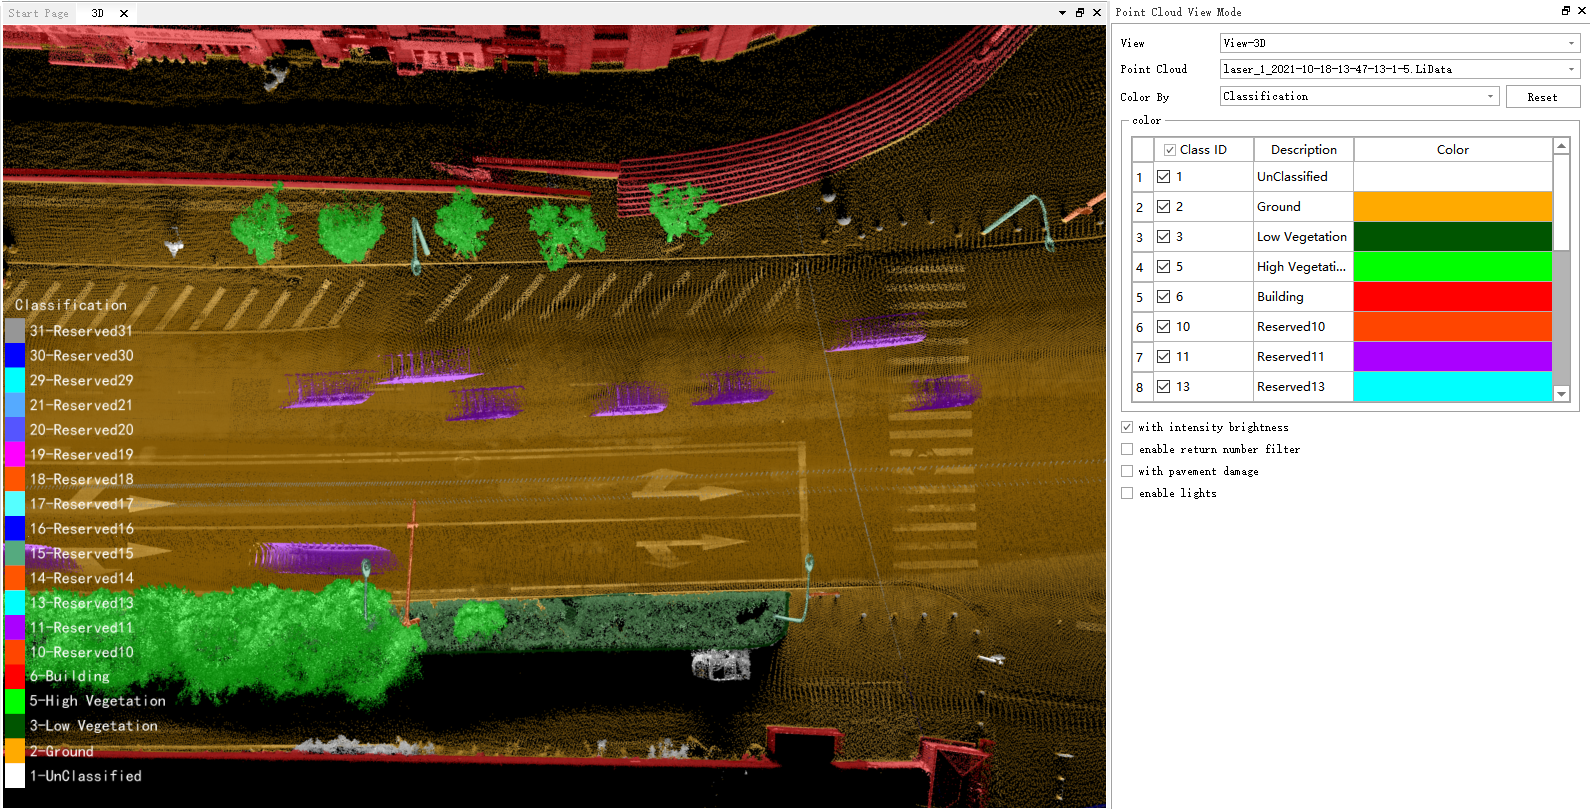
You can set the category to be displayed in the color display in the Display Mode window. In the checkbox at the bottom of the window, check the category to be needed.
Instructions
- Blend Intensity: If checked, the point cloud will blend the results of intensity stretching based on the main mode.
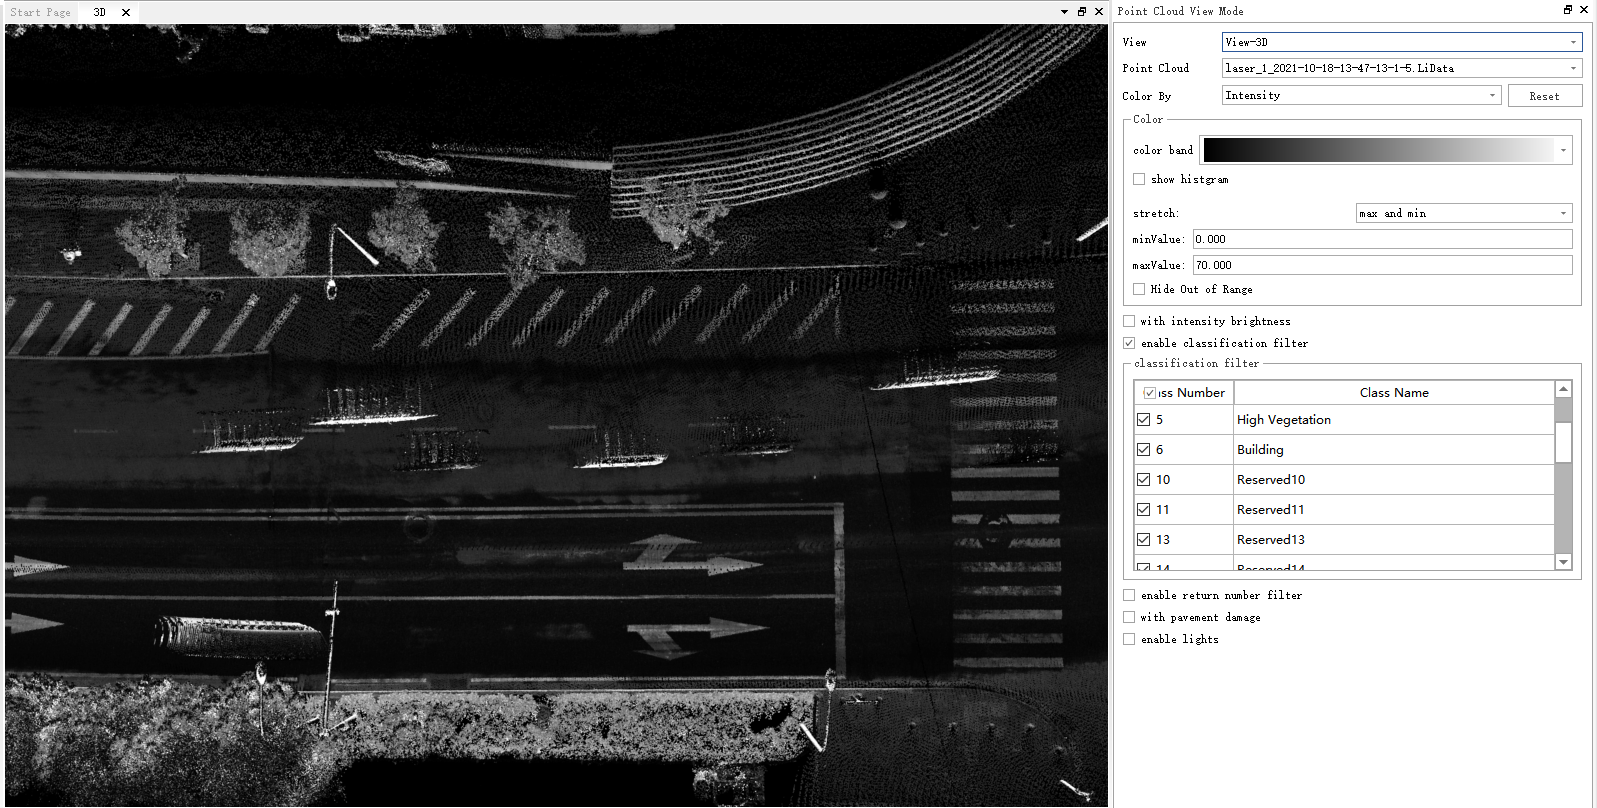
- Enable Classification Filtering: If checked, it filters the categories of point cloud data.
- Enable Echo Filtering: If checked, it can be used for the display of point cloud data, mapping the echo count of the point cloud data to different color values, more intuitively distinguishing point cloud data of different echo counts.
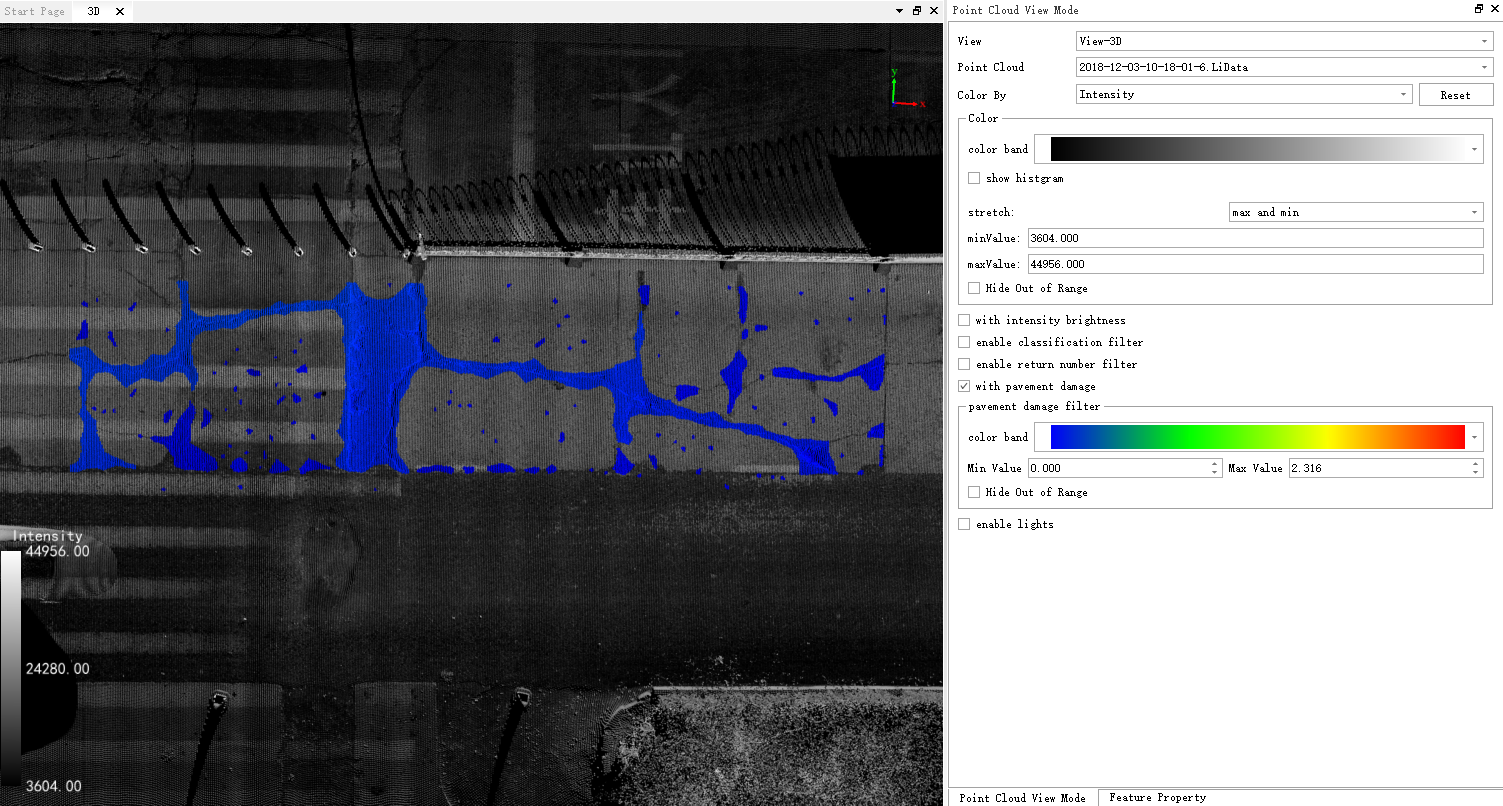
- Enable Road Damage Filtering: If checked, it can be used for the display of point cloud data, mapping the road damage attribute of the point cloud data to different color values, more intuitively distinguishing the situation of road damage.
- Enable Lighting: The data needs to have an additional attribute named Normal with 3 components. The color overlays the lighting effect of parallel light.
Common combination display modes include:
(1)Intensity Overlaid with Class Filtering:
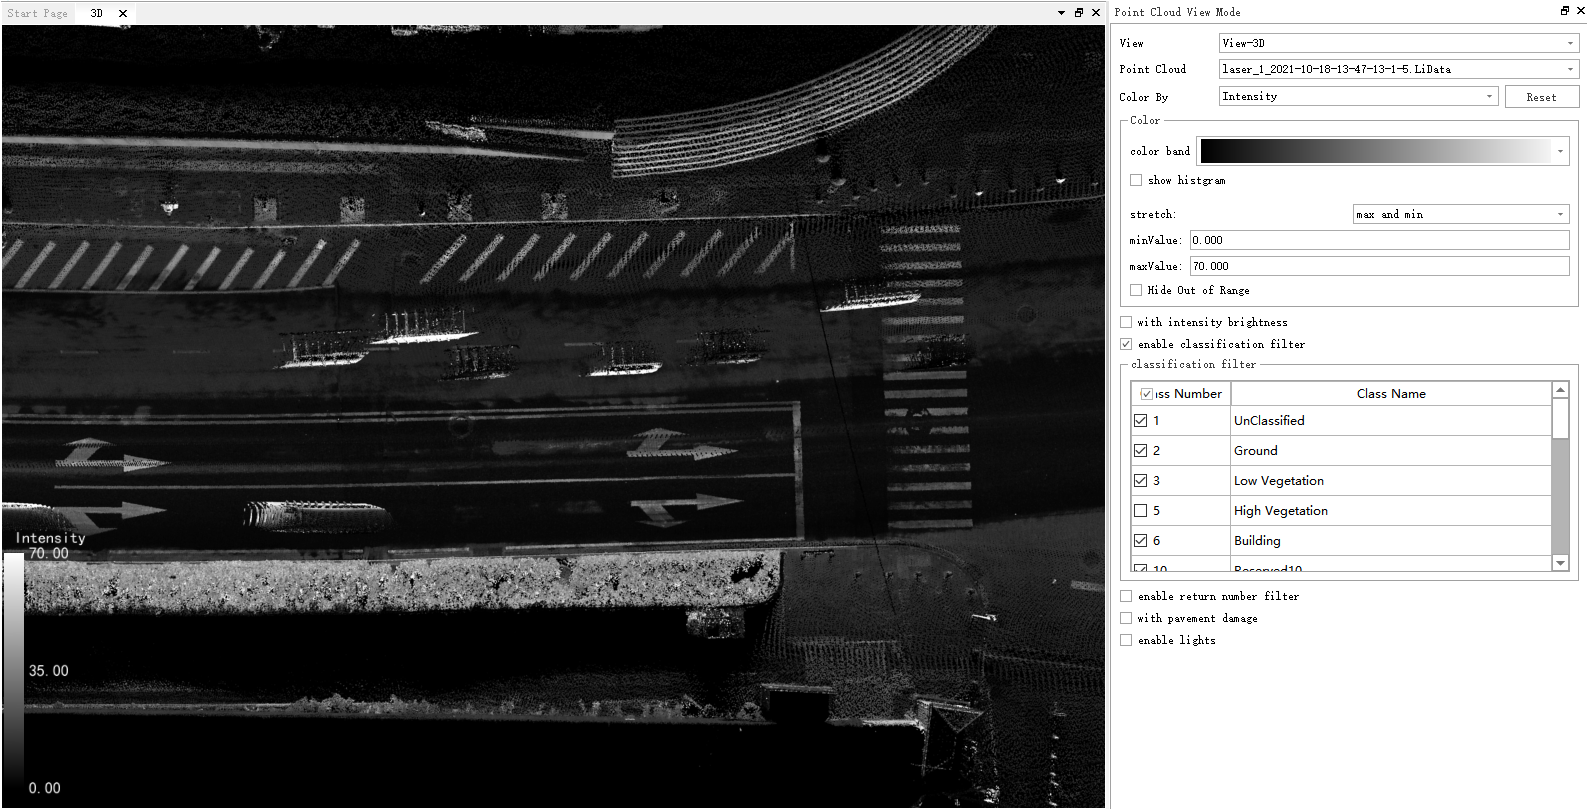
(2)Classification Overlaid with Intensity Filtering:
(3)Intensity Overlaid with Road Damage Filtering:
(4)Enable Lighting:
