Road Measurement Section Calculation
To ensure that the generated ground surface has no other noise points, point cloud classification operations can be performed first.
Prerequisite: Click the Road Section ![]() button to enter the road section calculation process. The measurement sections and export functions will become available, and a 2D section display box will pop up.
button to enter the road section calculation process. The measurement sections and export functions will become available, and a 2D section display box will pop up.
Only when the road section is in an active state can subsequent calculation buttons be used. Additionally, while the road section is active, the directory cannot be used to switch projects or modify design data (add, delete, or edit).
Calculate Measurement Data
Click the Calculate Measurement Data ![]() button to pop up the settings dialog.
button to pop up the settings dialog.
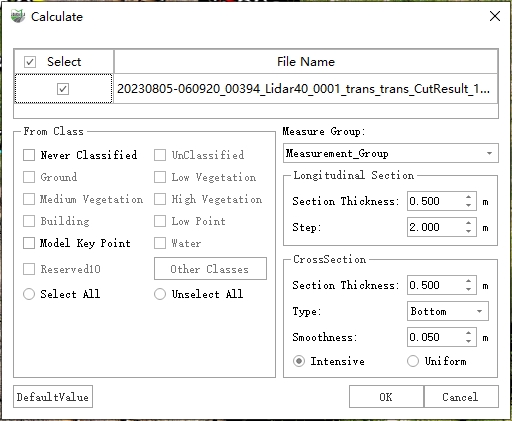
Fine Terrain
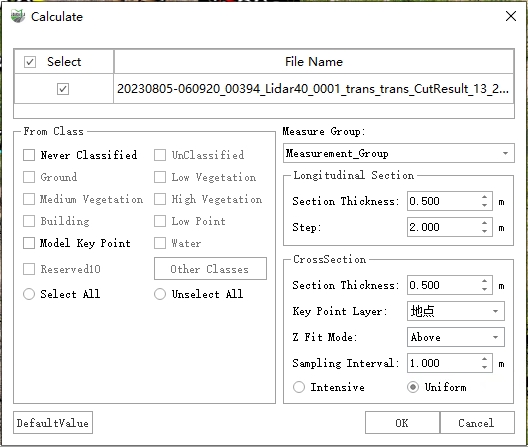
Uniform Terrain
Parameter Description
Measurement Group: Select the group of measurement data to be calculated.
Longitudinal Section:
- Section Thickness: The width of the point cloud data used to generate the measurement longitudinal section.
- Step: The sampling interval along the vertical axis for design.
Note: If a point cloud is missing near a sample point, the sample point will be deleted.
Cross Section - Fine Terrain: Extracts contours from the cross-sectional point cloud to generate detailed terrain.
Section Thickness: The width of the point cloud data used to generate the measurement cross-section.
Type: Generate cross-section drawings based on elevation type.
- Lower (default): Generates the lower half of the cross-section. This type is often selected for road scenarios.
- Upper: Generates the upper half of the cross-section.
If there are no other noise points in the road point cloud and no other point clouds above the road, the two will not differ significantly.
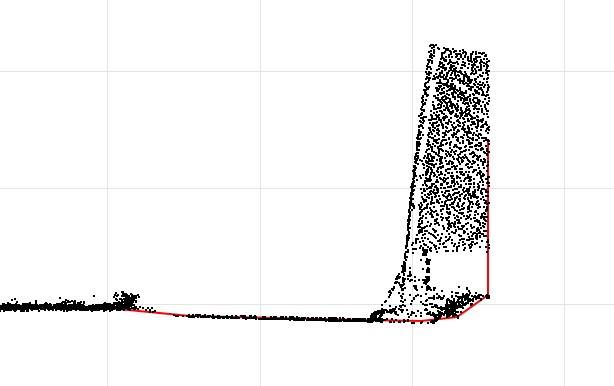
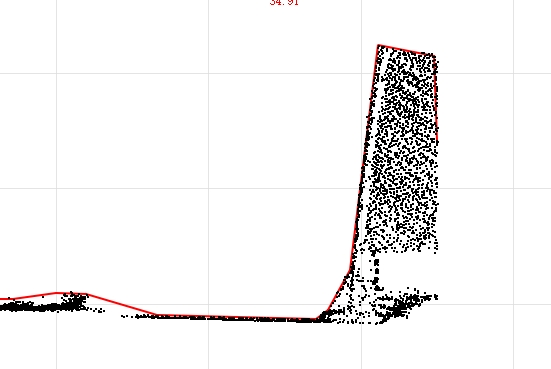
- Smoothness: Smooths the results by removing small undulations that are below the set value.
- Max Length: The width of the smallest detectable structure. If finer terrain details are desired, it can be reduced to 0.05, but this will also make it more susceptible to noise.
- Sampling Interval: Interpolation is performed on the cross-sectional vector line.
Cross Section - Uniform Terrain: Samples along the designed horizontal axis according to the set step size, and fits the terrain to generate a uniformly sampled topography.
- Section Thickness: The width of the point cloud data used to generate the measurement cross-section.
- Key Point Layer: The point layer where the sample points will be saved.
- Z Value Fitting Mode: Strategy for fitting sample points to the surface.
- Upper: Fits to the highest points of the point cloud.
- Average: Fits to the average value of the point cloud.
- Lower: Fits to the lowest points of the point cloud.
- Sampling Interval: The interval for sampling along the designed horizontal axis based on the set step size.
General:
- Source Category: The category of point clouds involved in generating the sections. Choosing the correct source category is crucial; incorrect selections may lead to erroneous results.
Result Illustration:

Fine Terrain

Uniform Terrain
The red line represents the generated measurement section, which is an automatically calculated result. If it does not meet expectations, you can use the 2D cross-section editor for manual adjustments.
Calculate Attributes
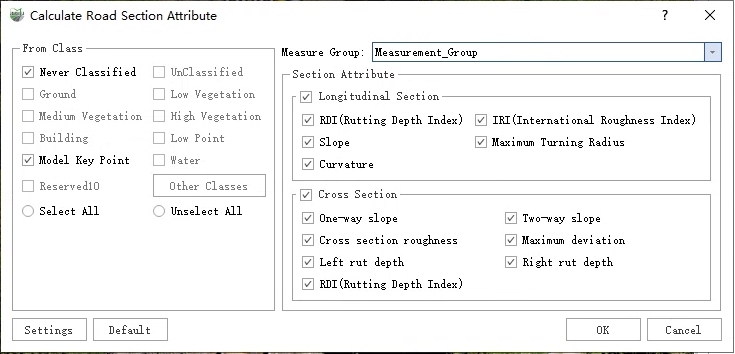
Calculate relevant road parameters based on measurement group.
Parameter Dialog Box:
Calculate Attributes
Parameter Description
Source Category: The category of point clouds involved in calculating road parameters. Selecting the correct source category is crucial; an incorrect selection may lead to erroneous results.
Measurement Group: The group of measurement data for which attributes are to be calculated.
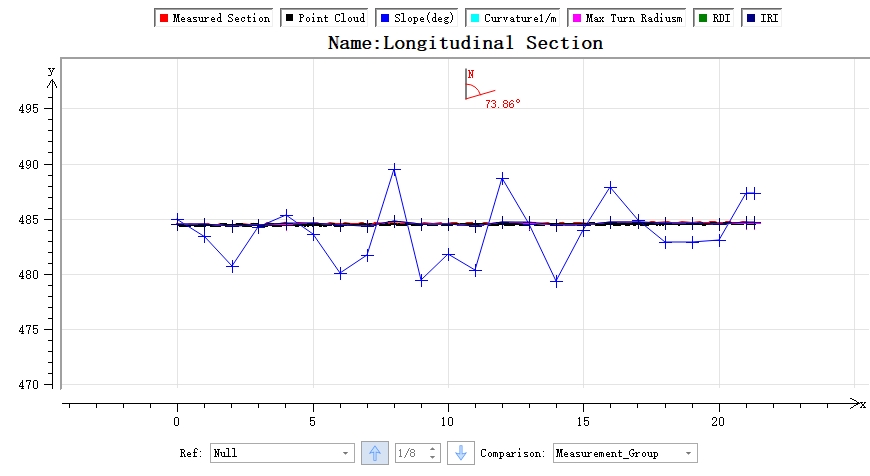
Longitudinal Section Parameters: All can be displayed on the canvas, and you can control the visibility of result parameters by clicking the appropriate buttons.
- Rutting Depth Index (RDI): Reflects the degree of rutting depth.
- International Roughness Index (IRI): An indicator used to measure the quality of the road surface, reflecting the degree of wear on the road. The unit is m/km.
- Slope: The change in height of the road along the longitudinal direction.
- Maximum Turning Radius: The maximum turning radius of the road in the lateral direction.
Curvature: The curvature of the road in the horizontal direction.
For the calculation of RDI and IRI, the parameters need to be set by clicking the "Settings" button on the interface.
RDI
- Thickness: The width of the point cloud along the left side of the longitudinal reference line used for calculating the RDI parameter.
- Left Width: The width of the point cloud along the left side of the longitudinal reference line used for calculating the RDI parameter.
- Right Width: The width of the point cloud along the right side of the longitudinal reference line used for calculating the RDI parameter.
- Thickness: The width of the point cloud along the left side of the longitudinal reference line used for calculating the RDI parameter.
IRI
- Base Line Length: The range of sampling points calculated by the single-point IRI. The lower the value, the more expressive the local flatness. The higher the value, the better the overall flatness.
Sampling Inverval: The smaller the sampling interval when calculating the cumulative height difference, the higher the calculation accuracy.
The road's longitudinal section is measured with baseline length as the unit. For each segment, a point is taken at the current point as the center, with half the baseline length as the radius. Points (section points) are sampled at equal intervals within this radius area. The formula is as follows.
where 'H[i]' is the elevation of the i-th sample point (Lower surface elevation in 'm'). 'L' is length of base line in 'km'.
Longitudinal Attribute
- Rutting Depth Index (RDI): Reflects the degree of rutting depth.
Cross-Section Parameters:
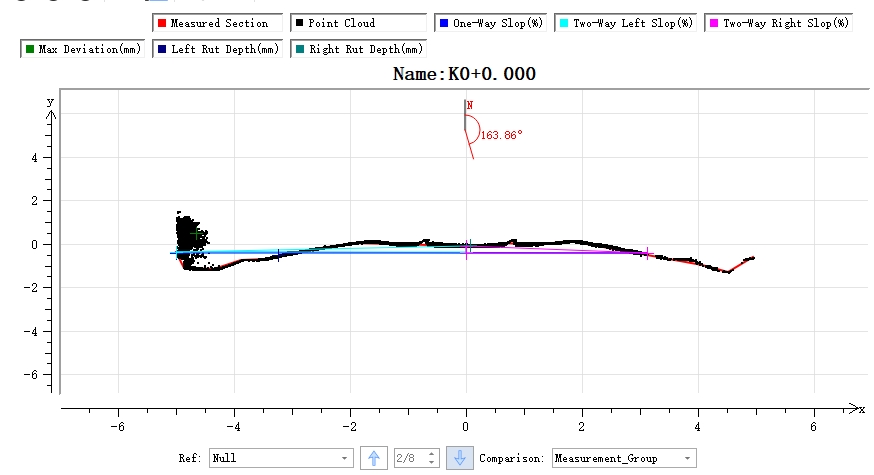
All parameters can be displayed on the canvas, and you can control the visibility of result parameters by clicking the appropriate buttons.
- Single-Slope: The ratio of the height difference between the leftmost and rightmost points of the current cross-section to the width of the pavement.
- Two-Way Slope: Calculates the single slope for both sides separately, using the center point as the dividing point.
- Cross-Section Roughness: The average distance from all points to the line connecting the leftmost and rightmost points.
- Maximum Deviation: The maximum distance from all points to the line connecting the leftmost and rightmost points.
- Left and Right Rut Depths: Measured using the 3-meter ruler method to determine the rut depths on the left and right sides.
- Road Rutting Depth Index: RDI.
Cross Section Attributes
Cross-Section Comparison
Steps
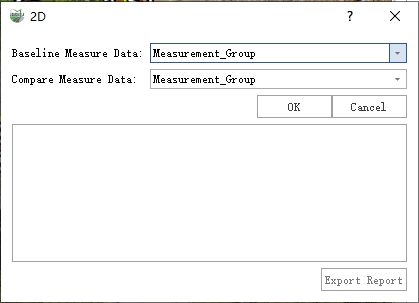
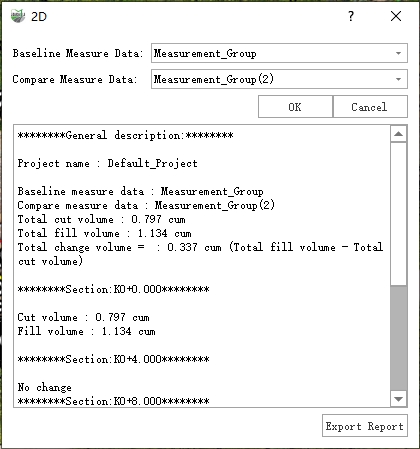
1.Click the Two-Phase Cross-Section Comparison ![]() button to open the dialog box.
button to open the dialog box.
Dialog
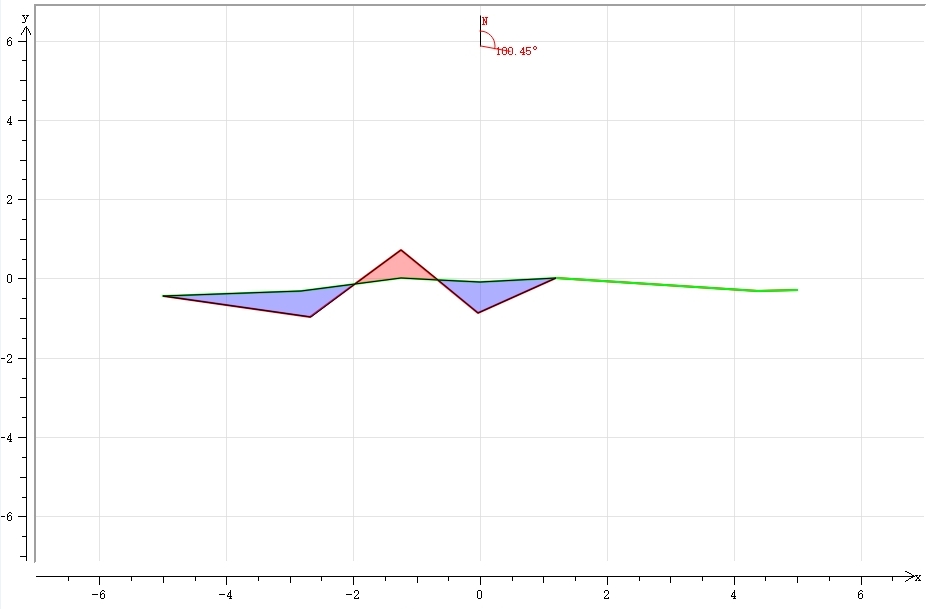
2.Calculation complete. A simplified calculation result is presented, and the 2D window displays different colors.
Result
Result
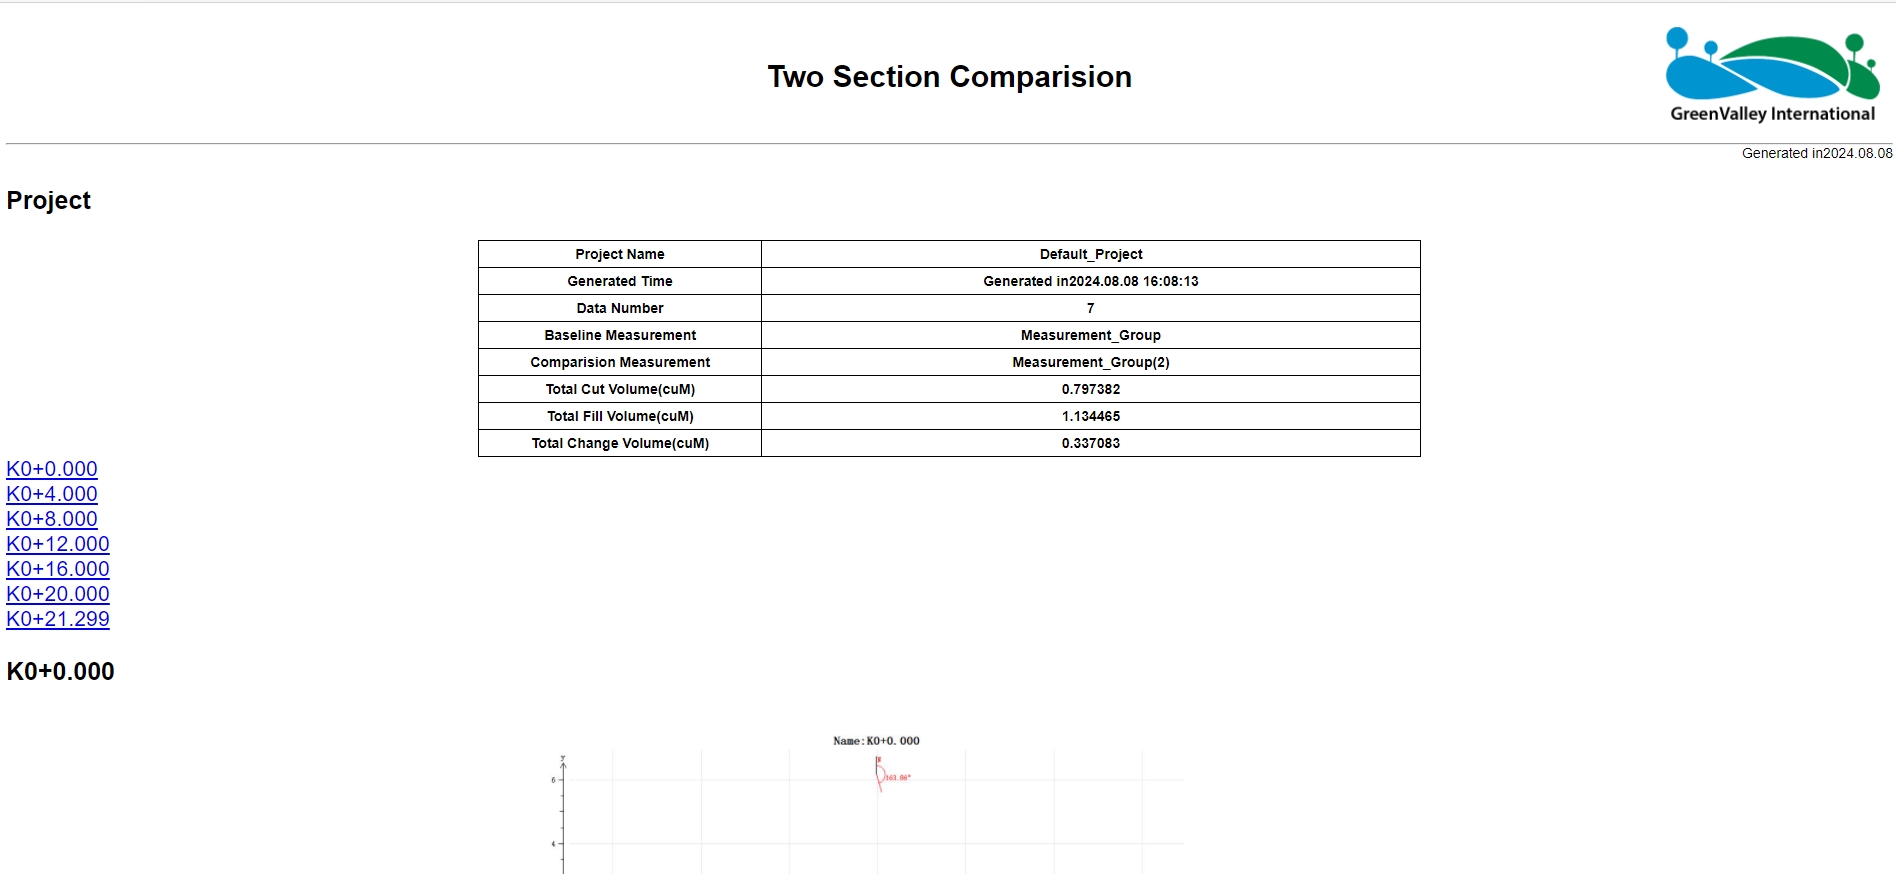
3.Click the Export Report button.
Report
Terrain
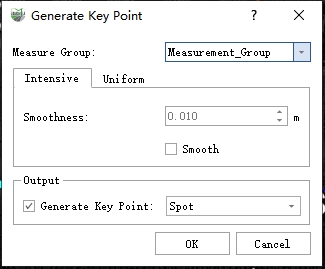
1.Click the Generate Key Point ![]() button to open the parameter dialog box.
button to open the parameter dialog box.
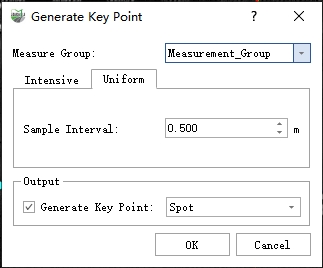
Dialog
Parameter Description
- Intensive: The key points are generated according to the fine topography of the measured section
- Smoothness : Smoothness, bumps or depressions that are less than the set value will be ignored.
- Smooth: Whether to enable smoothing, If it is not checked, the entire section point is output as the key point
- Uniform : On the xy-plane, perform uniform interpolation along the line, with z values fitting the measured cross-section line.
- Sample Interval :
- Output:
- Generate Key Point : choose the layer to save the key points.
Export Cross-Section
1.Click the Export Cross-Section ![]() button to open the parameter dialog box.
button to open the parameter dialog box.
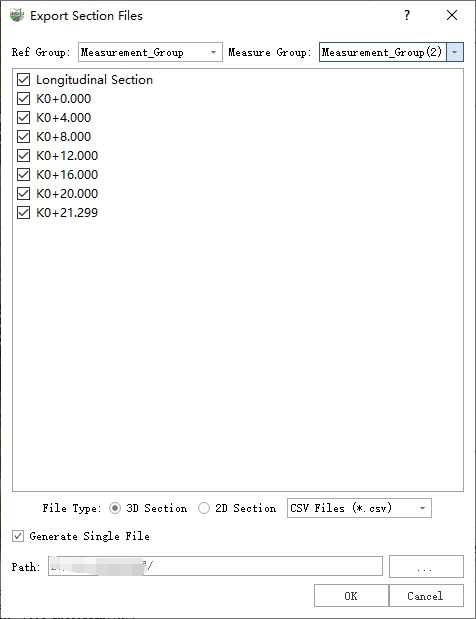
Dialog
Parameter Description
- .csv: A general format used internally by the software. The cross-section data read during the import of design cross-sections is in .csv format.
- .dxf, .shp: Two types of vector files that support importing into third-party software, such as AutoCAD, for viewing cross-section results and related data. For example, when generating a .dxf file, the parameter settings are shown in the image below. Set the output path, and click OK to proceed.
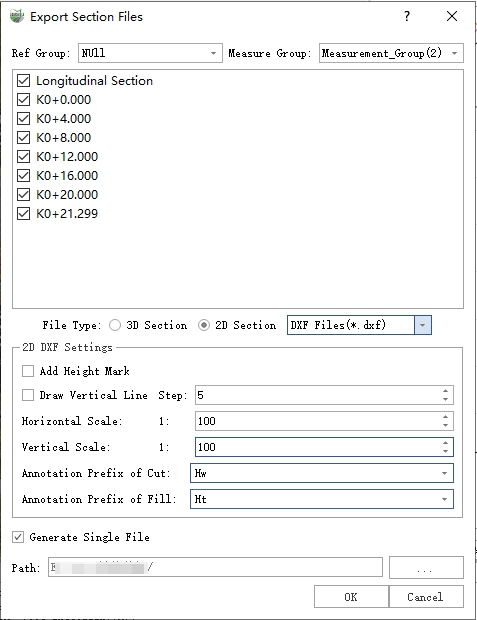
Dialog
Export PDF
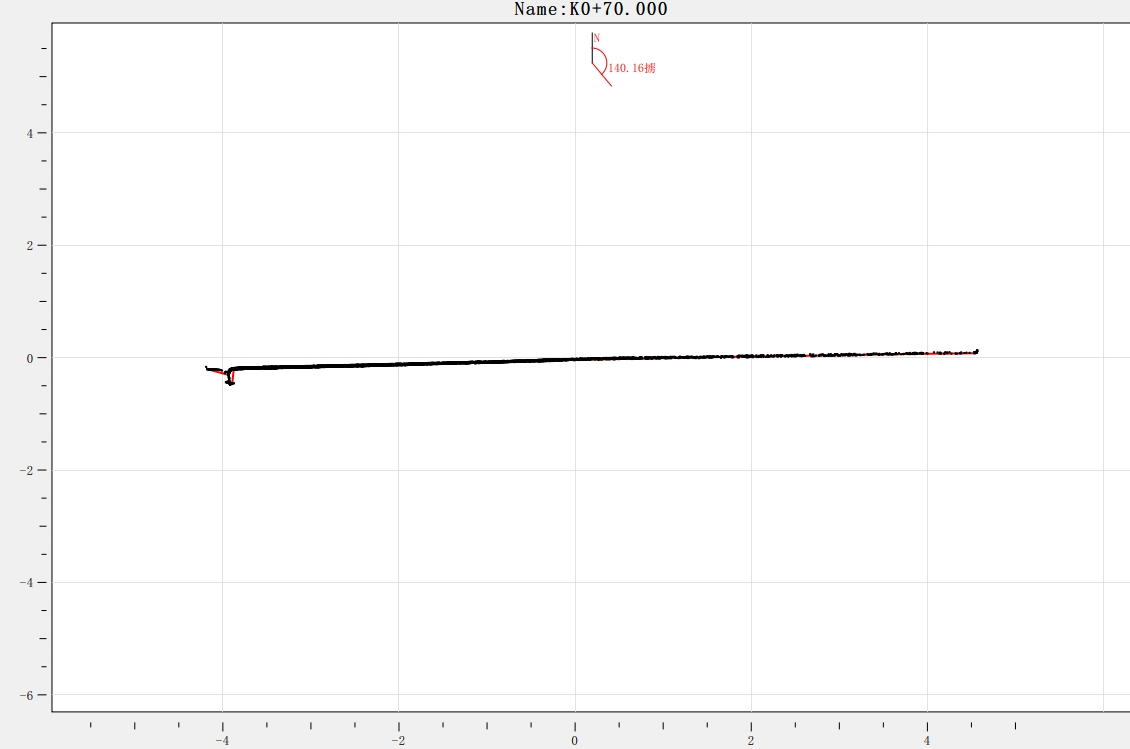
Export PDF
Export Cross-Section Attributes
1.Click the Export Cross-Section Attributes ![]() button to open the parameter dialog box.
button to open the parameter dialog box.
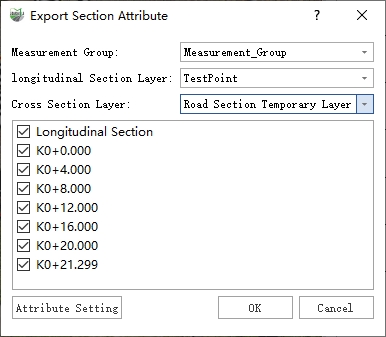
Dialog
Note: The measurement groups will only list those measurement data sets that have already had their attributes calculated.
2.Select the export path to complete the export of cross-section information.
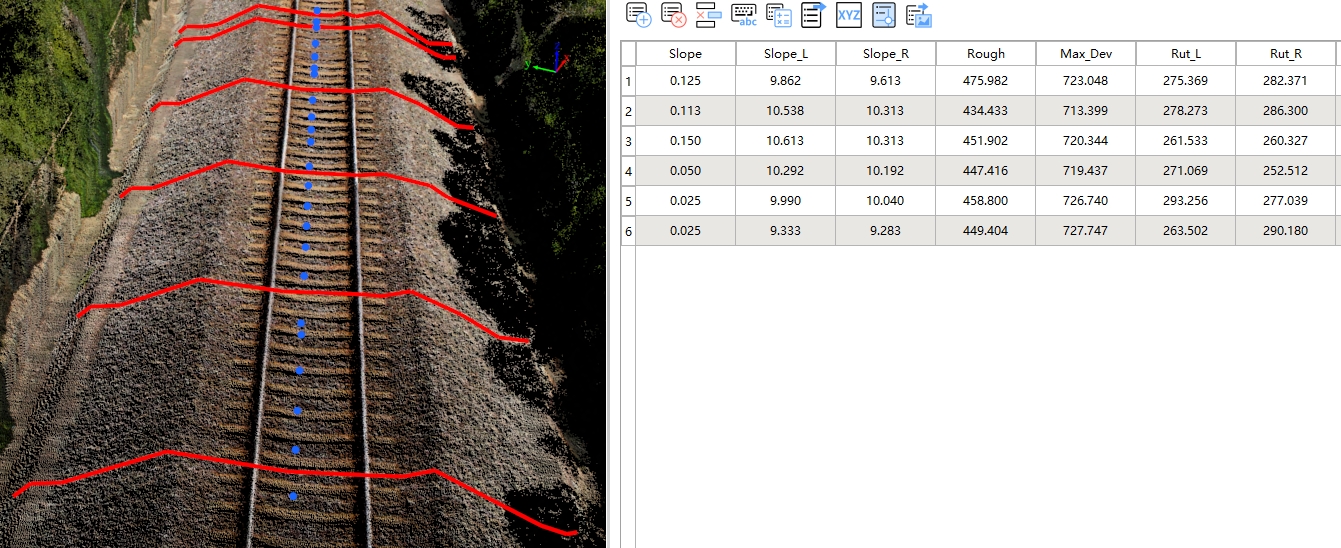
Field