Trajectory Layer
Root Node Right-Click Menu
Root node right-click menu for trajectory layer
Parameter Settings:
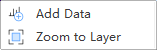
Add Data: Add trajectory file to current project.
Zoom to Layer: Calculate the bounding box of all current Image List data and display globally within this bounding box range in all windows that open this data.
Trajectory Right-Click Menu
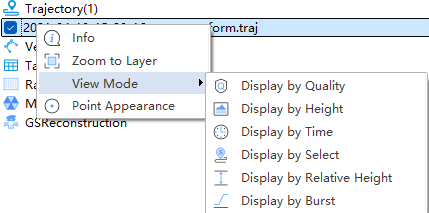
1.Info: View basic information about the point cloud, including the path where the data is located, coordinate information, minimum, maximum, average, and standard deviation values of X, Y, and Z, the minimum and maximum GPS times, the minimum, maximum, average, and standard deviation values of intensity, point cloud bounding box, total points, point cloud category statistics, and echo times statistics.

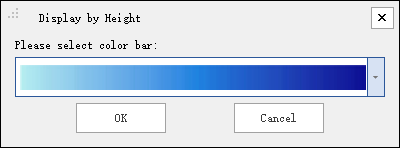
- Display by Height: A dialog box pops up as shown in the figure. The trajectory can be displayed by selecting different color bars.
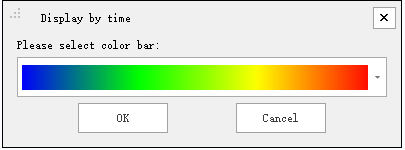
- Display by Time: The user data attributes of the trajectory data are mapped to different color values, more intuitively distinguishing trajectory data of different user data.
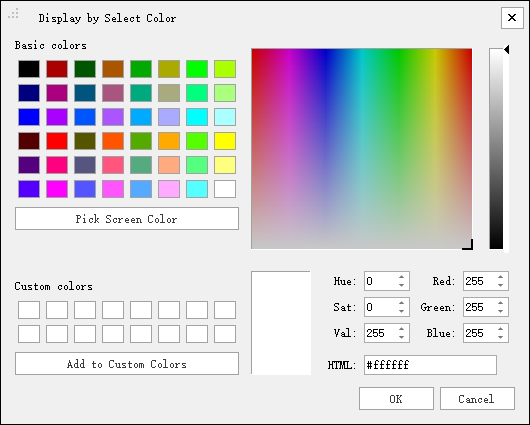
- Display by Selected Color: Each trajectory data is displayed in a specified color.
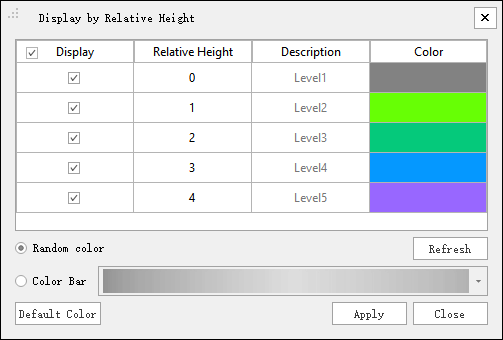
- Display by Relative Height: It can be used for the display of the trajectory, mapping the height difference of the trajectory at the same location on the road to the height difference level. Different height difference levels are shown in different colors.
- Display by Burst: It can be used for the display of the trajectory, displaying the values of the trajectory burst level field in different colors.
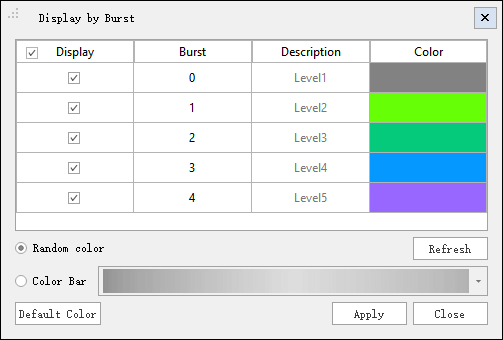
For specific calculation of trajectory burst level, see Trajectory Quality Detection.
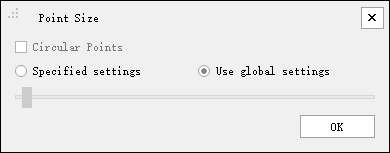
4.Point Appearance: Set the display mode size of a single trajectory: