Thematic Map
Function Description: Calculate and generate thematic maps for evaluating the three-dimensional visual quality of streets. The available indicators are: green volume, green view ratio, building view ratio and sky view factor.
Steps
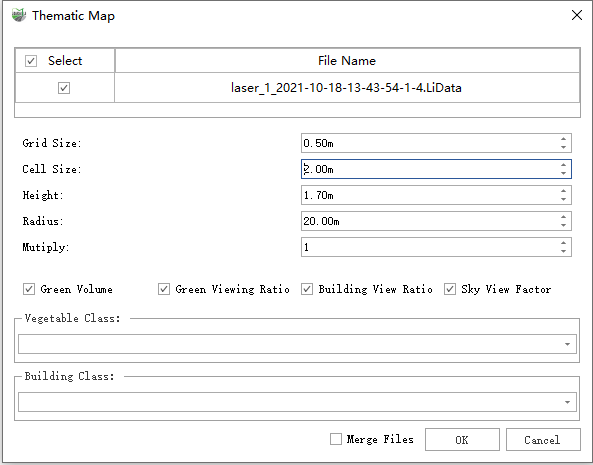
1.After launching the software, click on the Thematic Map ![]() button to open the parameter settings window. Select the desired indicators by checking the corresponding checkboxes:
button to open the parameter settings window. Select the desired indicators by checking the corresponding checkboxes:

Parameter Description
- Grid Size: Voxel size for point cloud voxelization.
- Cell Size: The size of each pixel in the generated thematic map.
- Height: The height of the viewpoint above the ground.
- Radius: The visual distance used for calculating the three-dimensional visual quality indicators.
- Mutiply: The subsampling factor for visual sampling during the calculation of three-dimensional visual quality indicators. A higher factor results in faster computation but lower accuracy.
- Green Volume: Calculate the volume of green vegetation for each ground grid. Check this checkbox to calculate this indicator.
- Green View Ratio: Calculate the ratio of visible green vegetation to total vegetation. Check this checkbox to calculate this indicator.
- Building View Ratio: Calculate the ratio of visible buildings to total buildings. Check this checkbox to calculate this indicator.
- Sky View Factor: Calculate the ratio of unobstructed sky view to total view. Check this checkbox to calculate this indicator.
- Vegetation Class: Specify the vegetation class for calculating the three-dimensional visual quality indicators. Low vegetation points, medium vegetation points and high vegetation points can all be classified as vegetation.
- Building Class: Specify the building class for calculating the three-dimensional visual quality indicators.
- Merge Files: Unchecked: Generate thematic maps separately for multiple files. Checked: After checking, support generating thematic maps separately for multiple files.
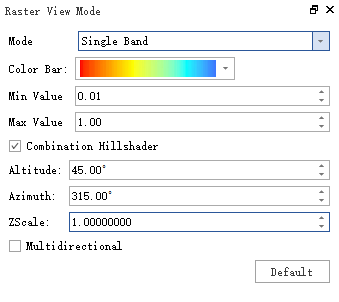
2.After clicking OK, the corresponding images will be generated and saved inside the raster according to the checked indicators: green volume, green view ratio, building view ratio and sky view factor. The Ortho window allows you to see how the images are displayed. Right-click Raster View Mode to bring up a pop-up box that allows you to view the generated images in different modes of display.

Raster View Mode Picture
Parameter Description
- View: Select to set the raster color.
- Mode: Display by Single Band stretch or Hill Shade effect (Only single-band raster is supported, multi-band is displayed in regular rgb).
- Color Bar: Select color sampling for single-band stretching.
- Max Value: Maximum value of single-band stretching.
- Min Value: Minimum value of single-band stretching.
- Combination Hillshader: Single-band superimposed hill shade effect.
- Altitude: The altitude angle is the angle of the sun's elevation above the horizon, which ranges from 0 to 90 degrees. A value of 0 degree indicates that the sun is on the horizon, i.e., in the same horizontal plane as the reference frame. The 90 degree value indicates that the sun is directly above the head. The default value is 45 degrees above the horizon.
- Azimuth: Azimuth is the relative position (in degrees) of the sun along the horizon. This position is indicated by the sun angle measured clockwise from due north. 0 degrees azimuth indicates due north, and 90 degrees due east, as well as 180 degrees due south and 270 degrees due west. The default azimuth is 315 degrees northwest.
- Z Scale: The Z Scale is the scale factor used to convert the elevation values. Its purpose is to convert height units (e.g. meters or feet) to horizontal coordinate units (possibly feet, meters or degrees) of the dataset, adding vertical exaggeration for achieving visual effects.
- Multidirectional: Multi-directional hill shading improves terrain visualization. This type blends light from six different directions to enhance the visualization of the terrain and improve the appearance of lower areas of the terrain. What's more, it results in the output of topographic backgrounds suitable for use as topography, soils, hydrology, land cover, or other thematic maps enhanced with data from topography.