Grid Statistics
Functional Overview
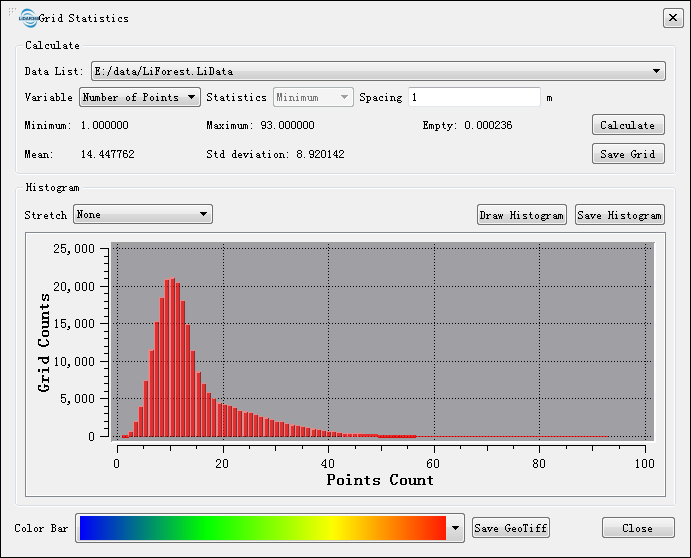
LiDAR360 supports fast grid statistics analysis on point cloud data. The tool supports meshing of point cloud data to count the number of points, density, and Z attributes in the grid. It can be used to view the point cloud data flight and processing quality, as well as analyze the geographical features of the flight area. If only one type of data in point cloud data is counted, the Extract tool can be used to extract point clouds and perform statistics.
Steps
- Select the point cloud data file to analyze from the Data List drop-down box.
- Select Variable to be analyzed. Users can select the variablesZ to be analyzed from the drop-down box.
- Set Spacing size.
- Click the Calculate button.
- Click Draw Histogram to view the histogram of the grid statistics. (Optional) You can also use Stretch method to stretch the histogram.
- (Optional)Users can click Save Histogram to save the displayed histogram as a PDF file.
- (Optional) Users can click Save Grid to save the statistics grid as a single-band grayscale image, or select Color Bar and click Save GeoTiff to map single-band grayscale images to multiband color images. It should be noted that if the user selects Stretch action, the single-band image will be mapped after stretching.
Usage
Click Statistics > Grid Statistics

Parameters Settings
- Data List: Users need to select point cloud data to be counted from the drop-down list.
- Variable: Users need to select the variable to be analyzed from the drop-down list. Fill the statistic value of the variable in the grid.
- Number of Points (default): Count the number of points in the grid.
- Density: Calculate the density of the point cloud within the grid, which is obtained by dividing the number of points by the grid area.
- Z: To calculate the user-defined Z-value of the point cloud in the grid, users need to select the statistics list.
- Statistics: If you select Z variable in the Variable list, users need to select the statistical method for Z variable.
- Minimum (default): The minimum value of Z variable in the statistics grid.
- Maximum: The maximum value of Z variable in the statistics grid.
- Mean: The average value of Z variable in the statistics grid.
- Range: The range of Z variable in the statistics grid (range = maximum - minimum).
- Deviation: The standard deviation of Z variable in the statistics grid.
- Spacing (m, default value: "1"): The size of the statistics grid.
- Calculate: After setting the parameters, click this button to calculate.
- Save Grid: Save the statistics grid as a single- band grayscale image in the format of .tif or .csv.
- Stretch: Users can choose whether to stretch Draw Histogram or Save GeoTiff.
- None (default): Do not perform any stretching operation.
- Minimum and Maximum: Use the maximum and minimum values of the statistical grid data for stretching. Linear stretch is applied based on the minimum and maximum pixel values, which will be regarded as the endpoints of the histogram. For example, the minimum and maximum values of a image are 2488 and 2656, linear stretch will rearrange the values based on a linear equation calculated from the maximum and minimum values to re-distribute pixel values from 0 to 255.
- Minimum (default value is the minimum of the grids): The minimum value of the stretch.
- Maximum (default value is the maximum of the grids): The maximum value of the stretch.
- Std Deviation: The stretching operation is performed using the standard deviation of the statistical grid data. The quasi-difference stretch type applies the linear stretching to the maximum value (maximum = mean + n standard deviation) and minimum value (minimum = mean - n standard deviation).
- n: The multiple of the standard deviation.
- Percent Clip: Percent stretch uses statistical grid data. Percent Stretch applies a linear stretch between the pixel values of the minimum and maximum cropping percentages. For example, the minimum and maximum values of a image are 2488 and 2656 respectively, and the user-defined minimum and maximum values of clipping percentage are 0.02 and 0.98 respectively. Values less than 0.02 stand for values between 2488 and 2492, and values above 0.98 stand for values between 2652 and 2656. The value between 2488-2492 will become 0, while the value between 2652-2656 will become 255. Other values will be distributed between 0-255.
- Minimum: The minimum stretch percentage, range 0~1.0.
- Maximum: The maximum stretch percentage, range 0~1.0.
- n: The multiple of the standard deviation.
- Draw Histogram: Draw a histogram of grid statistics in the canvas.
- Save Histogram: Save the drawn histogram in the PDF format.
- Color Bar: LiDAR360 provides 11 color bar options for users to choose.
- Save GeoTiff: Save statistical grid data as a multi-band color image based on the user-selected Color Bar.
- Close: Close the tool.
Note: The Save Grid function saves the original statistical result as a single-band TIFF file. Save GeoTiff function saves the result after histogram stretch and performs RGB three-channel mapping according to the selected color bar.