Theory of Elevation Metrics
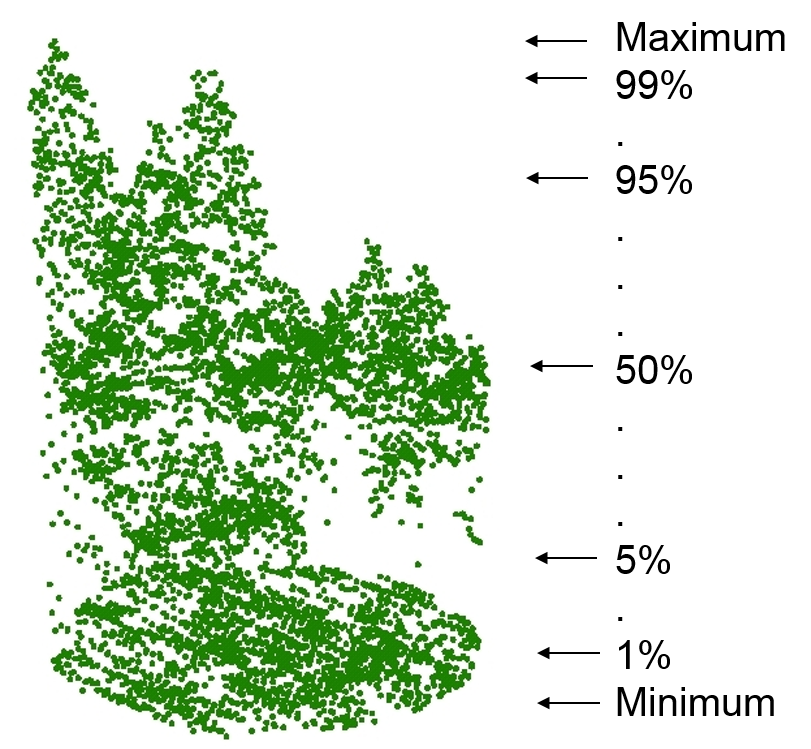
Elevation Metrics are statistical parameters related to point cloud elevation. They are frequently used in regression analysis as independent variables. In this model, 46 statistical parameters related to elevation and 10 parameters related to point cloud density can be calculated,
Principle Description
- Average Absolute Deviation: formula:
 , where Zi represents the elevation of ith point within a statistical unit, Z represents the average elevation of all points within a statistical unit, and n is the number of points in a statistical unit.
 - Canopy relief ratio: formula:
 , where mean represents the average elevation of a statistical unit, min represents the minimum elevation of a statistical unit, and max represent the maximum elevation of a statistical unit.
 - AIH (15): Within a statistical unit, all normalized lidar point clouds are sorted according to the elevation and the cumulative heights of all points are calculated. The cumulative height of X% points in each statistical unit is the statistical unit's AIH. In LiDAR360, 15 AIH can be calculated, including 1%, 5%, 10%, 20%, 25%, 30%, 40%, 50%, 60%, 70%, 75%, 80%, 90%, 95% and 99%.
- AlH Interquartile Distance: formula:
 , where AIH75% represents the 75% AIH statistical layer, and AIH25% represents the 25% AIH statistical layer.
 - Coefficient of Variation: It is the coefficient of variation of Z values for all points in a statistical unit. formula:
 , where, Zstd represents the standard deviation of elevation within a statistical unit, and, Zmean represents the average elevation within a statistical unit.
 - Density Metrics (10): The point cloud data is divided into ten slices with the same height interval from low to high, and the proportion of returns in each height interval is the corresponding density metrics.
- Kurtosis: The kurtosis of the Z value of all points in a statistical unit. formula:
 , where Zi represents the elevation of ith point within a statistical unit, Z represents the average elevation of all points within a statistical unit, n is the number of points in a statistical unit, and σ is the standard deviation of point cloud height distribution within a statistical unit.
 - MADMedian: The median of median absolute deviation.
- Maximum: The maximum value of Z of all points in a statistical unit.
- Minimum: The minimum value of Z of all points in a statistical unit.
- Mean: The mean value of Z of all points in a statistical unit.
- Median: The median of Z of all points in a statistical unit.
- Generalized means for the 2nd power: formula:
 , where Zi is the Z value of the ith point n in a statistical unit, and n is the number of points in a statistical unit.
 - Generalized means for the 3rd power: formula:
 where, Zi represents the elevation of ith point within a statistical unit, and n is the number of points in a statistical unit.
 - Elevation Percentile (15): Within a statistical unit, all normalized lidar point clouds are sorted by elevation, and then the elevation at which X% of points in each statistical unit are located is the elevation percentile of this statistical unit. In LiDAR360, 15 elevation percentiles are calculated, including 1%, 5%, 10%, 20%, 25%, 30%, 40%, 50%, 60%, 70%, 75%, 80%, 90%, 95% and 99%.
- Elevation Percentile Interquartile Distance: formula:
 , where Ele75% represents the 75% elevation statistical layer, and Ele25% represents the 25% elevation statistical layer.
 - Skewness: This value shows the symmetry of Z values of all the points in each statistical unit. formula:
 , where Zi represents the elevation of ith point within a statistical unit, Z represents the average elevation of all points within a statistical unit, n is the number of points in a statistical unit, and σ is the standard deviation of point cloud height distribution within a statistical unit.
 - Standard Deviation: The standard deviation of Z values of all points in a statistical unit.
- Variance: The variance of Z of all points in a statistical unit.
