Raster Context Menu
Summary
The context menus are used to for data import, removal, query, display, etc.
Data Type Context Menu
The user can open this menu by right clicking the raster data type.
- Import Data: The raster data formats supported by LiDAR360 include TIF and JPG. The function is the same as the tool
Add Data.
- Remove All: Remove all the raster data from the project.
Data Context Menu
The user can open this menu by right clicking a raster data object.
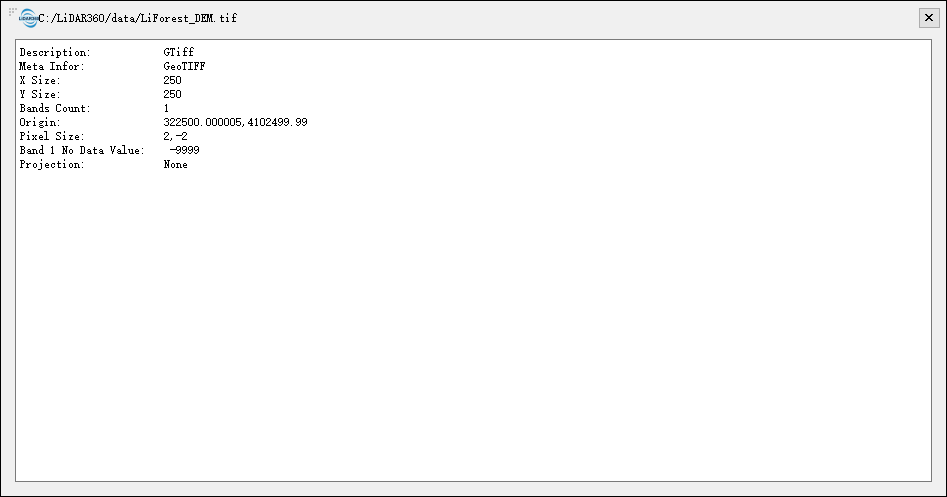
- Info: View the basic information of raster data, including file path, description, X size, Y size, bands count, pixel size, invalid value of each band, projection, etc. The interface is shown below.

Open Containing Folder: Open the folder.
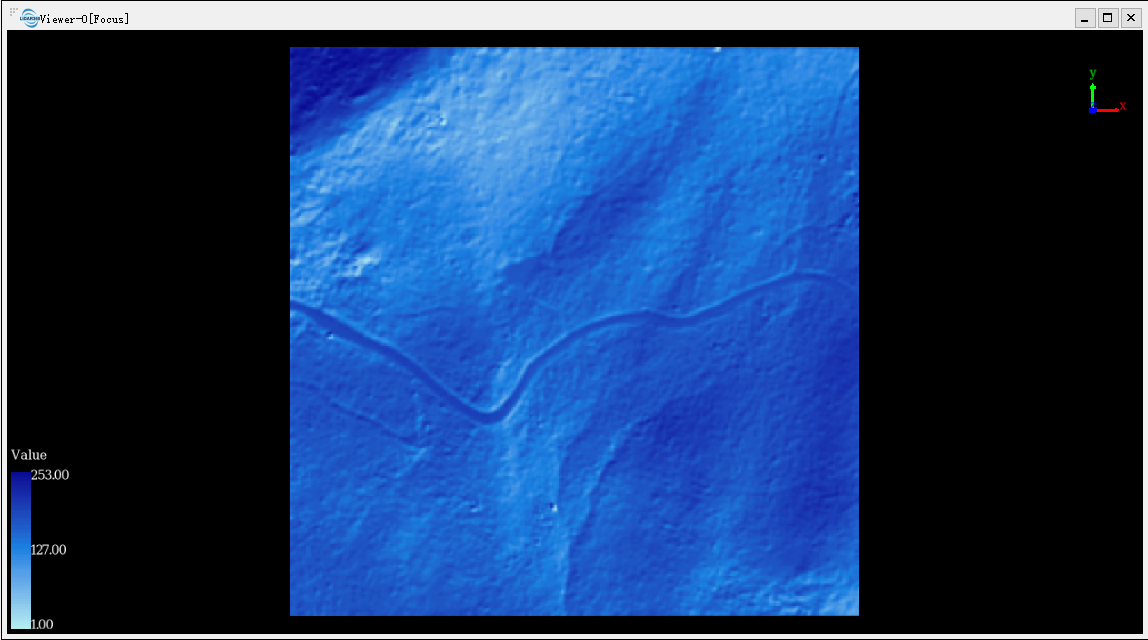
Histogram: View the histogram of the raster data, where the values of each band can be stretched separately. The raster data is displayed in gray color bar by default. Select an appropriate color bar in the combo box. Click the button "Apply", the raster data in the scene will be rendered according to the above settings, as shown below.

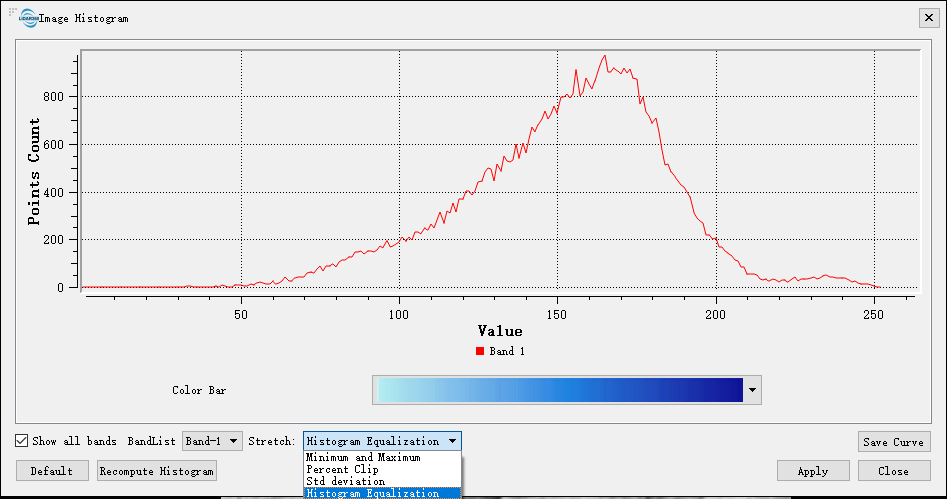
Select the stretch method and generate the corresponding histogram, as shown below.

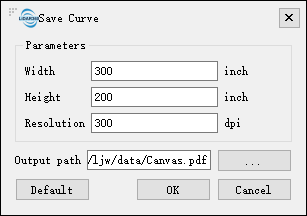
The button "Default" is used to restore the default settings. The button "Recompute Histogram" is used to calculate all the pixel values of the raster data again. The sampling points are 250000 by default. When the pixel size of the raster data exceeds the value, the statistical results may be inaccurate, then this button is needed. The histogram can be saved in *.pdf format. Click the button "Save Histogram" to pop up the following interface. Set the width, height, resolution, output path of the histogram and click "OK" button to save the result to local disk.

Zoom to Layer: Calculate the bounding box of the current raster data. All the windows, in which the data object is loaded, will show full extent of the bounding box.
- Zoom to Native Resolution (100%): Display the raster data in 1:1 ratio according to the resolution of the raster data.
- Select RGB bands:For multi-band raster data, select the R (Red), G (Green), and B (Blue) bands for display.
Modify Wavelength:For multi-band raster data, the wavelength information of the raster can be modified. When wavelength information is not recorded in hyperspectral imagery, this function allows users to set the wavelength for each band. It also enables marking bad bands and supports automatic bad band identification (based on whether the statistical information of each band is an outlier and the corresponding .hdr file). Both the wavelength and bad band columns in the table can be manually edited.

"Use Built-in Sensor": Checking this option allows assigning wavelengths to each band using a built-in sensor. After enabling, the "Import Metadata" section will be grayed out. Users need to select a sensor and click Apply to populate the wavelength values in the table. Custom sensors can also be defined.
The sensor name can be customized. "Import Metadata": Supports importing .hdr, .xml, and .txt files. hdr files must be in ENVI format. xml files refer to .aux.xml files generated by software like QGIS that contain wavelength information. txt files are user-defined files with one wavelength value per line.
"Automatically Identify Bad Bands": Clicking this button will automatically detect bad bands and check the corresponding "Bad Band" options in the table for the affected bands.
- Remove: Remove the selected raster data from the current project. This function is the same as the tool
Remove.
Settings
- Histogram:
- Stretch: The stretch methods of the histogram.
- Minimum and Maximum (Default): Apply a linear stretch based on the minimum and maximum pixel values, with the minimum and maximum pixel values as the endpoints for the histogram. For example, the minimum and maximum pixel values of the image could be 2488 and 2656 respectively. The values can be stretched linearly between 0 and 255. Distributing pixel values over the entire histogram range, the brightness and contrast of the image are increased and features in the image are easier to distinguish.
- Percent Clip: Apply a linear stretch between the pixel values defined by percent clip minimum and percent clip maximum. For example, the minimum and maximum pixel values of the image could be 2488 and 2656 respectively. Percent clip minimum and percent clip maximum values are 0.02 and 0.98, values less than 0.02 mean the values between 2488 and 2492, values more than 0.98 mean the values between 2652 and 2656, values between 2488 and 2492 become 0, values between 2652 and 2656 become 255, the remaining values are between 0 and 255.
- Std deviation: Apply a linear stretch between the pixel values defined by the std deviation (n) value. For example, the minimum and maximum pixel values of the image could be 2488 and 2656 respectively. If the value of standard deviation (n) is defined as 2, then the values beyond 2 standard deviation become 0 or 255, the remaining values stretch between 0 and 255.
- Histogram Equalization: Apply a non-linear stretch between the pixel values, redistribute the pixel values so that the pixel values in a certain range is approximately equal. This method works well when there are a lot of pixel values that are closely grouped together.
- Color Bar: The colorbar supports several uniformly varying color intervals for color mapping.
- BandList: Select a band from the band list to draw the histogram.
- Show all bands (Optional): Whether to show all bands.
- Stretch: The stretch methods of the histogram.
- Save Curve:
- Width: The width of the saved curve.
- Height: The height of the saved curve.
- Resolution: The resolution of the saved curve.
- Output path: The output path of the saved curve.