Point CLoud Context Menu
Summary
The context menus are used to for data import, removal, query, display, statistics, export, etc.
Data Type Context Menu
The user can open this menu by right clicking the point cloud data type.
- Import Data: The point cloud data formats supported by LiDAR360 include LiData (*.LiData), LAS (*.las, *.laz), ASCII (*.txt, *.asc, *.neu, *.xyz , *.pts, *.csv), PLY (*. ply), and E57 (*.e57). The LiData is the proprietary point cloud data format, on which the point cloud processing are based. Other imported formats of LAS, ASCII and PLY will be converted to LiData for subsequent processing. This function is the same as the tool
Add Data.
- Remove All: Remove all the point cloud data from the project.
Data Context Menu
The user can open this menu by right clicking a point cloud data object.
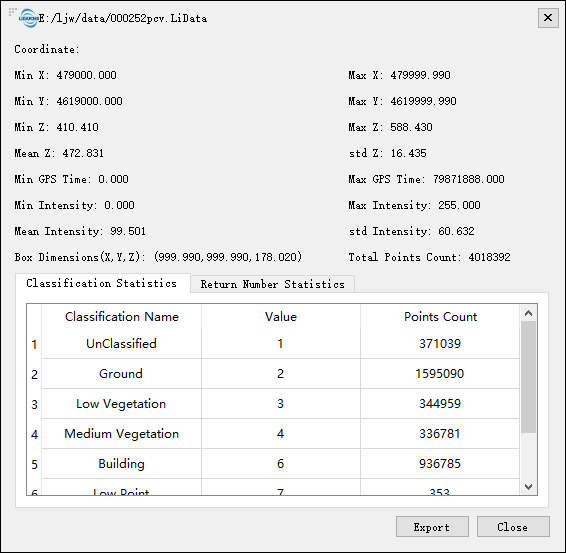
Info: View the basic information of the point cloud, including the path of the data, the coordinate information, the minimum and maximum values of X, Y, and Z coordinates, the average and standard deviation of Z, the minimum and maximum GPS time, the minimum, maximum, and average intensity Value and standard deviation, point cloud bounding box, total points, point cloud category statistics and echo frequency statistics. If additional attribute information is included, the maximum, minimum and type of each additional attribute will be displayed. as the picture shows. Click the "Export" button to export the basic point cloud information as a txt file.
Open Containing Folder: Open the folder.
- Rename: Rename the file.
Display: Set the display mode of a single point cloud file. LiDAR360 supports up to 20 display modes for a single point cloud file, including display by elevation, display by intensity, display by category, display by RGB, display by back Wave count display, GPS time display, tree ID display, route edge display, echo count display, point source ID display, scan angle display, scan direction display, user data display, scan channel display , Display by near-infrared, display by selected color, display by mixed display, display by combination display mode, display by additional attribute, display additional attribute by RGB, etc. Several display mode setting methods are described in detail below.
Display by Elevation: The interface as shown in the figure will pop up, and you can stretch by the minimum and maximum values or standard deviation to improve the display effect. When stretching according to the minimum and maximum values, you can set whether to display or hide the data outside the range of the minimum and maximum values.
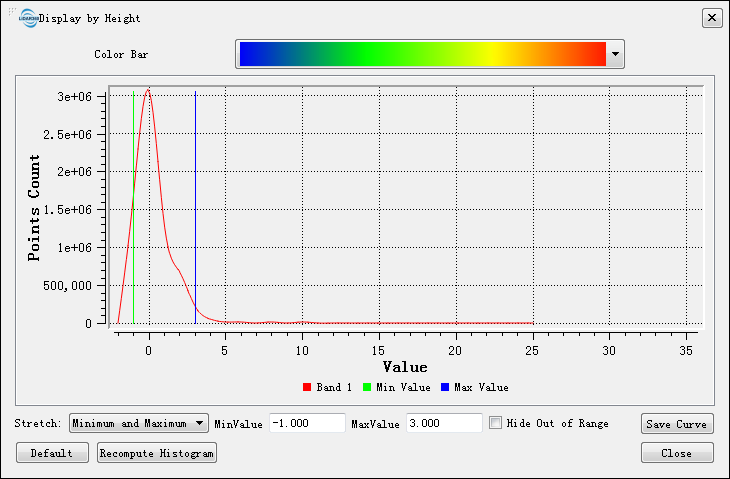
"Recalculate the histogram" is used to count and generate a histogram of all the points' elevation. When opening this function, the histogram of sampled points' elevation is displayed by default, and the histogram may be inaccurate. The recalculate the histogram function can take all the points' elevation into account, and generate an accurate histogram.
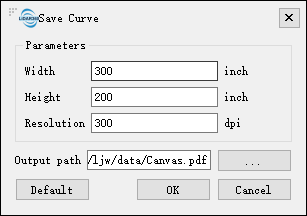
The curve can be saved in pdf files. Click the button "Save Curve" to pop up the following interface. Set the width, height, resolution, output path of the curve and click "OK" button to save the curve to local disk.
Display by Additional Attributes:The following window will popup.
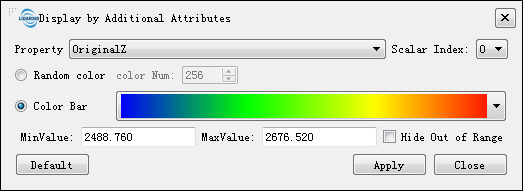
(Optional) Select the attribute needs to set the color from the attribute drop-down list.
- (Optional) Select the index of the attribute needs to modify from the scalar index drop-down list box.
- (Optional) Select a random color and set the number of colors to be configured in the Number of Colors box.
- (Optional) Select a color bar from the color bar drop-down list.
- (Optional) Set the stretching range for the additional attribute component using the minimum and maximum values.
- (Optional) Check "Hide data outside range" to prevent points outside the minimum and maximum values from being displayed.
- (Optional) Click "Restore Defaults" to set the minimum and maximum value fields to the default range for the corresponding attribute component data.
- (Optional) Click the "Apply" button to finalize the display effect as shown in the image.
Click the "Close" button to exit the settings interface.
Display Additional Attributes by RGB: Open the interface as shown in the image.

- (Optional) Select the attribute to configure colors from the attribute dropdown list.
- (Optional) Set the display component indices for the red, green, and blue channels respectively.
- (Optional) Click "Restore Defaults" to reset the red, green, and blue channel indices to their initial default values.
- (Optional) Click the "Apply" button to finalize the display effect as shown in the image.
Click the "Close" button to exit the settings interface.
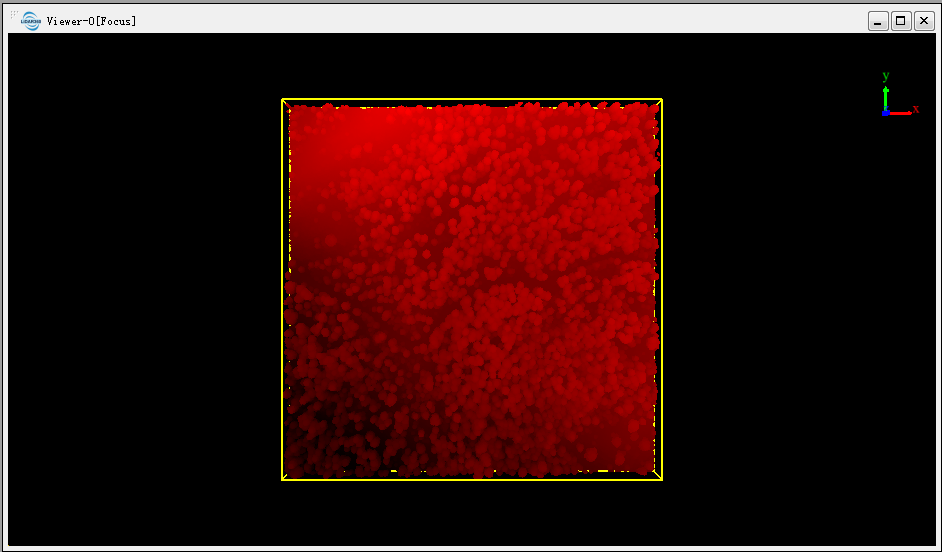
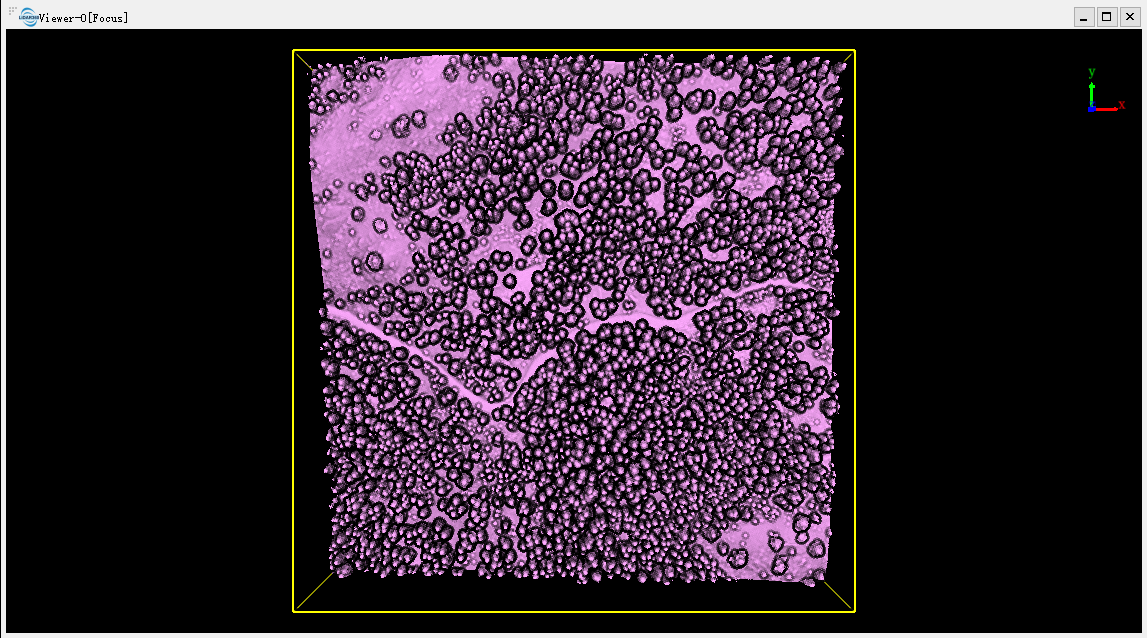
Display by Tree Attributes: Display point clouds based on tree attributes. This function requires associating the point cloud with the corresponding tree attribute file.
- Select both the point cloud and the tree attribute file to be associated in the directory tree, right-click and select "Bind Tree Attributes" to associate the tree attribute file with the point cloud.
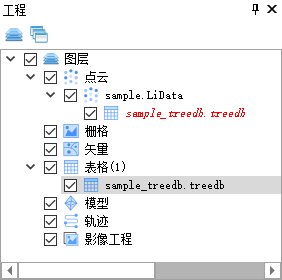
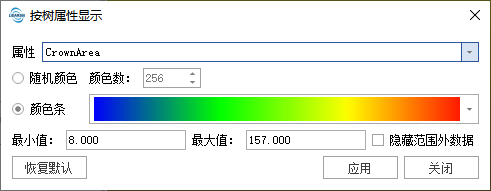
- Select the point cloud, right-click > Display Mode > Display by Tree Attributes, and the following interface for displaying by tree attributes will pop up. Choose the attributes and color bar to display, and click "Apply" to display the point cloud according to the corresponding tree attributes.
Zoom to Layer: Calculate the bounding box of the current point cloud data. All the windows, in which the data object is loaded, will show full extent of the bounding box.
Restatistics: Recalculate the Mean Z, Std Z, Mean Intensity and Std Intensity of point cloud data. This function is used to repair older versions of LiData which may contain incomplete information.
- Export: Export the point cloud data to LAS (*.las, *.laz), ASCII (*.txt, *.asc, *.neu, *.xyz, *.pts, *.csv), PLY (*.ply), and E57 (*.e57) format. The supported LAS version for export are 1.2,1.3,1.4, and the default version is 1.4. This function is the same as the tool
Export.
- PCV: Process the point cloud data with PCV to improve the visual effects.
- Point Size: The point size of each point cloud data object can be set separately or set uniformly according to the global settings. The shape of points can be set to circle or square. The interface is shown as follows.
For global point size settings, see the usage of the tool
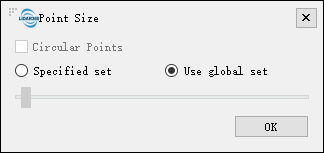
Configure Point Size.
Point Brightness: Set the brightness of a single point cloud data or all the point cloud data, as shown below:
To set the brightness of all point cloud data, users can click the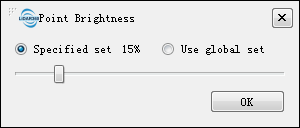
icon in the settings tool bar. For more details, please refer to Display Options.
Remove: Remove the selected point cloud data from the current project. This function is the same as the tool
Remove.
Settings
- Display by Height:
- Color Bar: The colorbar supports several uniformly varying color intervals for color mapping.
- Stretch: The stretch methods of the histogram.
- Minimum and Maximum (Default): Apply a linear stretch based on the minimum and maximum pixel values, with the minimum and maximum pixel values as the endpoints for the histogram. For example, the minimum and maximum pixel values of the image could be 2488 and 2656 respectively. The values can be stretched linearly between 0 and 255. Distributing pixel values over the entire histogram range, the brightness and contrast of the image are increased and features in the image are easier to distinguish.
- Std deviation: Apply a linear stretch between the pixel values defined by the std deviation (n) value. For example, the minimum and maximum pixel values of the image could be 2488 and 2656 respectively. If the value of standard deviation (n) is defined as 2, then the values beyond 2 standard deviation become 0 or 255, the remaining values stretch between 0 and 255.
- Display by Intensity:
- Stretch: The stretch methods of the histogram.
- Minimum and Maximum (Default): Apply a linear stretch based on the minimum and maximum pixel values, with the minimum and maximum pixel values as the endpoints for the histogram. For example, the minimum and maximum pixel values of the image could be 2488 and 2656 respectively. The values can be stretched linearly between 0 and 255. Distributing pixel values over the entire histogram range, the brightness and contrast of the image are increased and features in the image are easier to distinguish.
- Std deviation: Apply a linear stretch between the pixel values defined by the std deviation (n) value. For example, the minimum and maximum pixel values of the image could be 2488 and 2656 respectively. If the value of standard deviation (n) is defined as 2, then the values beyond 2 standard deviation become 0 or 255, the remaining values stretch between 0 and 255.
- Stretch: The stretch methods of the histogram.
- Save Curve:
- Width: The width of the saved curve.
- Height: The height of the saved curve.
- Resolution: The resolution of the saved curve.
- Output path: The output path of the saved curve.
- Point Size:
- Circular Points (Optional): Set the shape of the point to circle or square.
- Specified set (Optional): Set the point size of the specified point cloud data separately.
- Use global set (Optional): Set the point size of the specified point cloud data with global settings.
Note:Except the import data function, other right-click menu functions work on all viewers loaded with the point cloud.