Tree Growth Analysis List
Summary
Settings
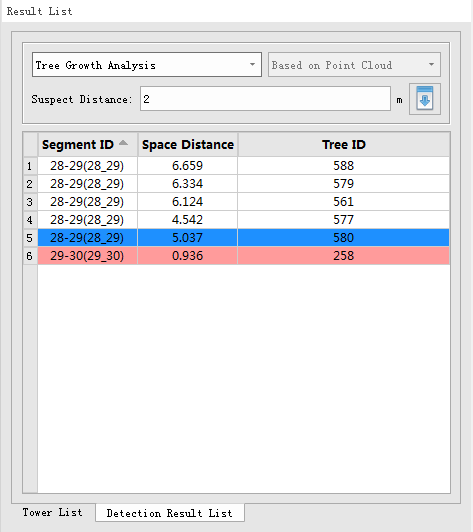
- Suspected Distance (meter) (default value is "2"): Suspected danger point distance. The danger points with clearance distance less than this threshold will be marked as red in the danger points list. This parameter is used to filter out the invalid danger points which is misclassified because of the error in the classification process of the point cloud.
Load Data
Load or renew the detection result list.
Note: When the option "Customize the growth rates of different tree species" is checked, tree growth analysis tool will not be applicable to those tree with unknown species information. But those trees which is tall enough to be the "danger tree" will be marked as "danger tree" anyway.
Note: Click the header of the detection result table to switch between ascending and descending display by the selected attribute values in the table.
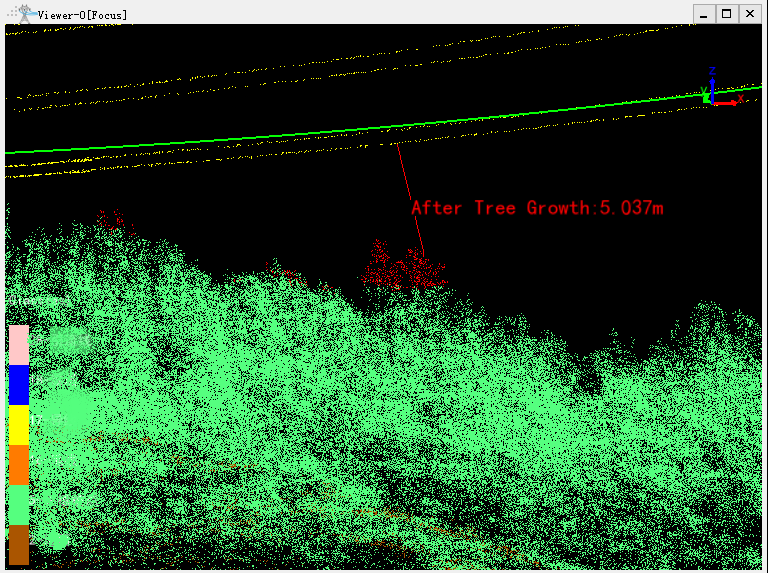
Note: After the detection, view details in the detection result list. Double-click the row of the danger point record to zoom to that point in the 3D scene and display the distance between the danger point and the power line. And judge if the danger point is misclassified due to the error in the classification of the point cloud. If so, user can use Profile Tools to modify the classification result first, then Clear the detection results. Finally redo the detection to correct the error.