Display by Height
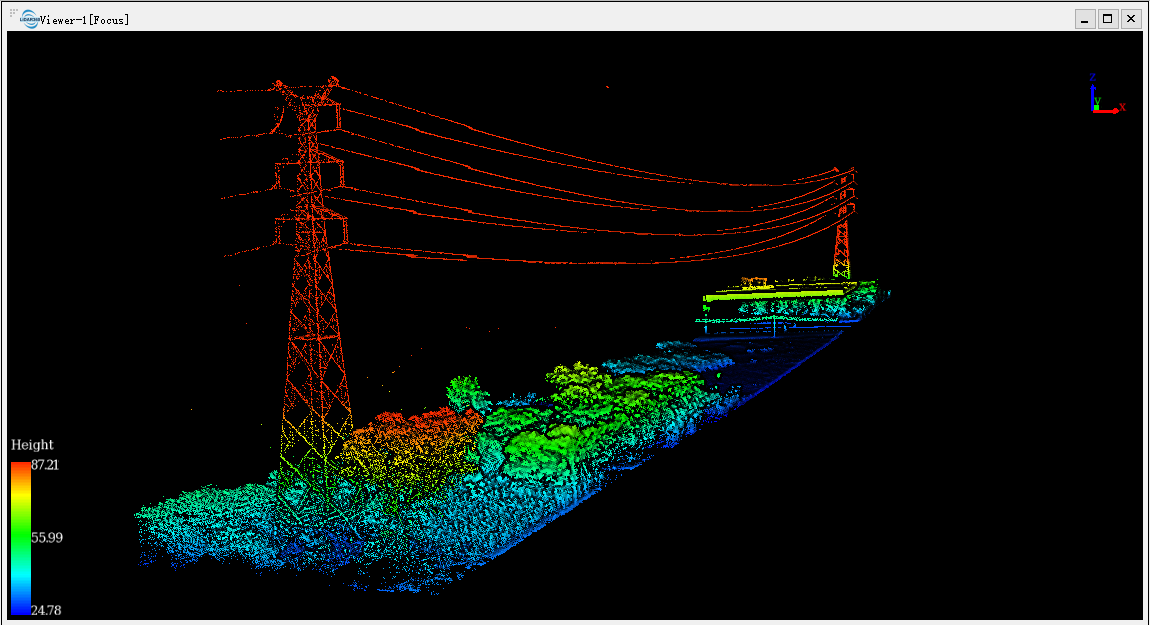
Brief: This tool is used for displaying point cloud data. The elevation values of point cloud data are mapped to several uniformly varying color intervals, so as to display the variation of elevation values more intuitively.
Steps
- Click the window that loads point cloud data with the left mouse button and set it as the active window.
- Click the button
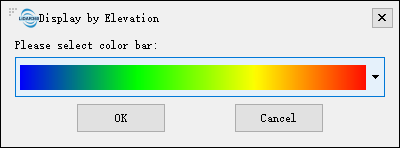
 on the toolbar to pop up the dialog "Display by Elevation", as shown below.
- Select the appropriate color bar in the combo box and click the "OK" button. The color indicator of the window will generate the corresponding color bar according to the elevation range of the point cloud data. At the same time, the data is displayed by elevation in the scene. The visual effects are better with EDL mode, as shown below.

Note: This tool only works with point cloud data.