Exercise 2: Vegetation encroachment detection
Use the output datasets generated from Exercise 1, or the data provided in SampleData Exercise2345 folder for the following exercise.
Detecting danger points
Vegetation and other objects encroaching the clearance space in power line corridor should be managed properly for maintaining services and ensuring safety purposes. In this exercise, you will use LiPowerline’s Danger Point Detection tool to detect vegetation that violates the user defined clearance distances, and to generate a report to present the analysis results to your organization and clients.
1 Click Realtime Working Conditions Analysis ![]() > Danger Point Detection
> Danger Point Detection ![]() .
.
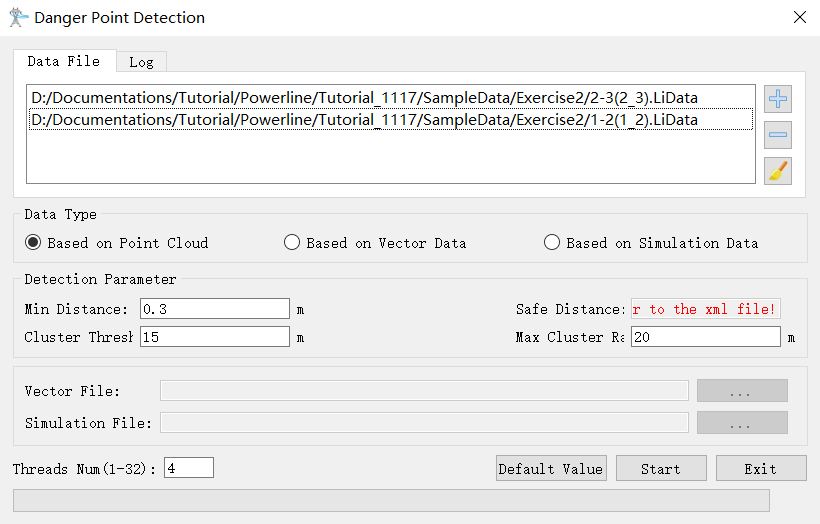
1.1 In the Danger Point Detection window, add the 1-2(1_2).LiData and 2-3(2_3).LiData dataset to the Data File list.
1.2 For Data Type, select Based on Point Cloud.
In this sample dataset, the data acquisition quality is good and power line points are dense. Therefore, Based on Point Cloud Data Type is used in detecting danger points.
In your own project, if significant amount and/or sections of power line points are missing, for example, the arc of the power line is not completely reproduced, then you should use Based on Vector Data method to detect danger points. In that case, select the Powerline.shp file generated from vectorizing power lines as Vector File.
1.3 For Detection Parameter, accept the default values:
- Min Distance: All points detected within 0.3 meter of the power lines will be treated as noise and ignored;
- Cluster Threshold: Two points with distance less than 15 meters are classified as one cluster;
- Max Cluster Range: If the length of a cluster along the power line direction is larger than 20 meters, break this cluster into several.
- Safe Distance: the xml file saved in Classify and Detect Parameters settings will be used for safe distance.
1.4 For Vector File, leave it as empty.
1.5 For Simulation File, leave it as empty.
In Exercise 3, we will generate a simulation file under specified weather scenario. You can rerun Danger Point Detection analysis using simulation file to detect vegetation encroachment under certain weather conditions.
1.6 Click Start to start running Danger Point Detection process.
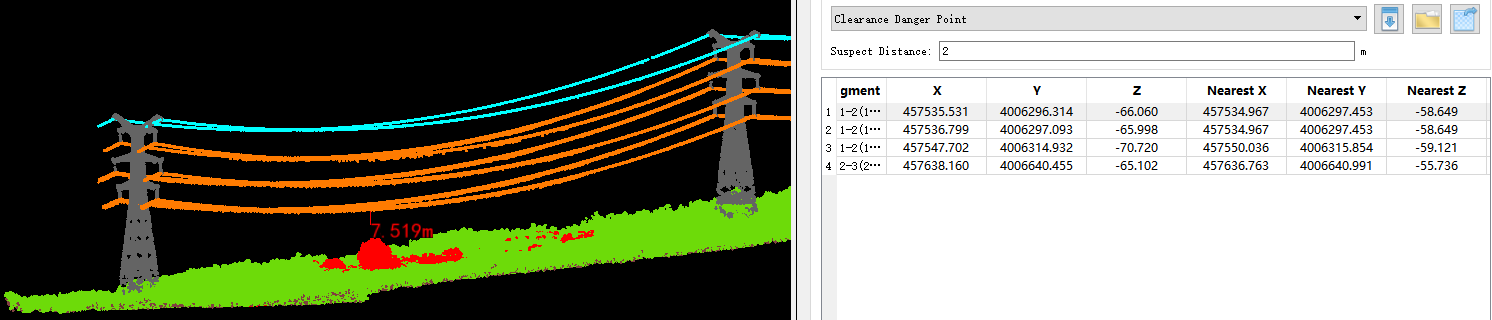
When finished, the points detected as danger will be colored in red, and a table of clusters will be added to the Power Line Danger Points window.
In this project, there are four clusters detected as danger points, three in section 1-2, and one in section 2-3.
1.7 Double-click on one row in the table, and the view will center to that cluster and the distance to the power line will displayed on the view.
Generating reports
After analysis, the results can be compiled into a HTML report using Generate Report tool in LiPowerline, and the clusters of vegetation encroaching power line clearance distance can be exported as KML file.
1 HTML Report
1.1 Click Render Image ![]() .
.
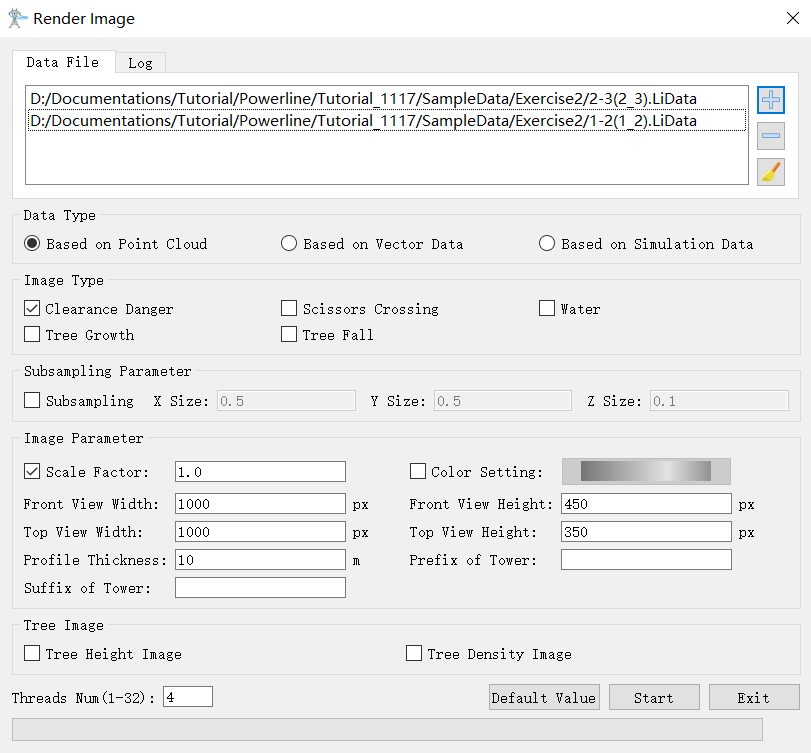
1.1.1 In Render Image window, remove all other datasets except for 1-2(1_2).LiData and 2-3(2_3).LiData in Data File list.
1.1.2 For other parameters, use the default values.
1.1.3 Click Start to run.
1.1.4 Click OK when finished.
1.2 Click Generate Report ![]() to generate a report in HTML.
to generate a report in HTML.
1.2.1 Fill in Company names and other parameters under Generate Report session if necessary.
1.2.2 Set Report Path to working directory.
1.2.3 Click Start.
1.2.4 When finished, click OK in the Success window.
1.2.5 The report automatically opens in your default browser.
If your default browser is Internet Explorer and if ActiveX control warning pops up, enable ActiveX control to open the report.
2 Danger points in KML file
2.1 Click Tool Box > Dangers to KML.
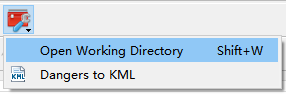
2.2 Select output folder and click Start to run the tool. The danger points and area are exported as KML file.