Exercise 1: Power line corridor modeling
3D models of power line infrastructures are important data asset for power line corridor management. Informed by accurate location information and high spatial resolution, decisions in design and planning, management, and maintenance can be made with less uncertainties. LiPowerline utilizes machines learning algorithms to automatically classify power lines and towers, ground, and other objects, which significantly advances the modeling process.
Use the dataset in Exercise1 folder as input data for this exercise.
Classifying power lines and towers using Machine Learning
1 Load data
1.1 Launch LiPowerline ![]() software as Administrator.
software as Administrator.
1.2 Click File > Data > Add Data, browse to the downloaded PowerlineSample.LiData dataset, and Open. The point cloud dataset is added automatically to the PointClouds Layers group in Project Management Window, and the Power Line Parameter Setting window opens automatically.
LiPowerline supports .las and .LiData. If .LAS file is opened, the Open LAS File window is opened for initial properties set up.
1.3 In the Power Line Parameter Setting window, under the Setting tab, set Working Directory to your working folder.
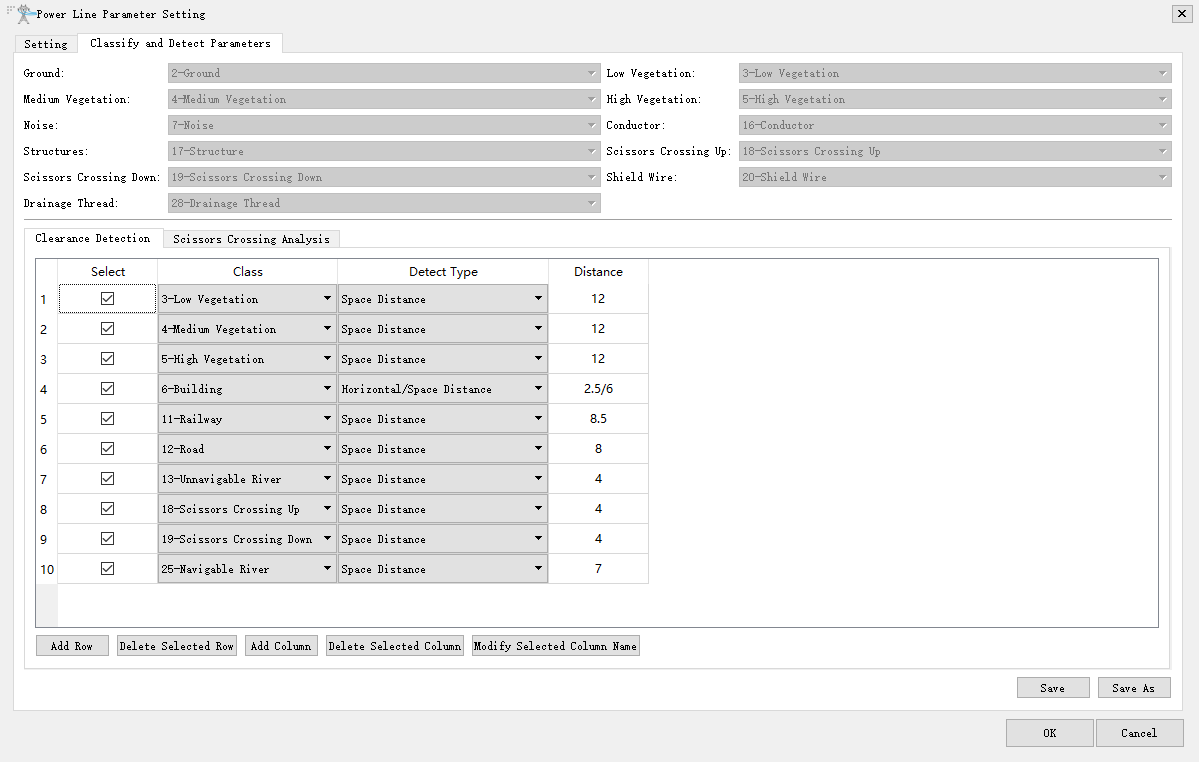
1.4 For Classify and Detect Parameters, please select "Sample.xml" file in the software installation folder, for example: C:\Program Files\LiDAR360Suite\LiPowerline\Sample.xml. Parameters set up in Clearance Detection are used to determine whether an object should be classified as dangerous points in the Danger Point Detection analysis in Exercise 2.
1.4.1 For Detected Line Voltage Level, select 220kV.
1.4.2 Click Classify and Detect Parameters tab. Notice that the parameters have been populated using values set in the Sample.xml configuration file. Customize the parameters for this project:
1.4.2.1 Ground clearance is not within consideration in this project. Therefore, select the first row, and click Delete Selected Row.
1.4.2.2 Change detection distance for Class 3-Low Vegetation, 4-Medium Vegetation, 5-High Vegetation to 12 meters, meaning that vegetation within 12 meters of power lines violates clearance distance.
1.4.2.3 Click Save As, save the file as config.xml file in the working directory.
In your own project, if the default classification schema is different from the schema your organization uses, you can customize the schema:
Click Display on LiPowerline toolbar > Class Setting Options.
Class 0 – Never Classified, 1 - Unclassified, 2 - Ground are fixed classes that cannot be changed. Other than these classes, double-click on the name of the class and type in the new name.
If you don’t have a configuration file for your project, you can create one in the Classify and Detect Parameters window:
Select a Detected Line Voltage Level.
After adding a new voltage level in the Setting window, you can set its corresponding detection parameters for clearance violation detection and scissors crossing analysis in the Classify and Detect Parameters window. Click on the Classify and Detect Parameters tab, and click on Clearance Detection tab.
Click Save to save the parameters as a config.xml file for future reuse.
2 Mark the towers
The locations of power tower can be marked manually on the map, or by importing vector files (.LiTower, .kml, .txt, .csv). To mark towers on the map:
2.1 In the Power Line panel, click Mark Tower ![]() to start editing towers.
to start editing towers.
2.2 Click Add Tower Backward ![]() , on the point cloud map view, left-click on the top center of power towers sequentially to add location of all towers along the power line. For each tower, change its type to Tension Tower or Straight Line Tower. In this project, all three towers are Straight Line Tower.
, on the point cloud map view, left-click on the top center of power towers sequentially to add location of all towers along the power line. For each tower, change its type to Tension Tower or Straight Line Tower. In this project, all three towers are Straight Line Tower.
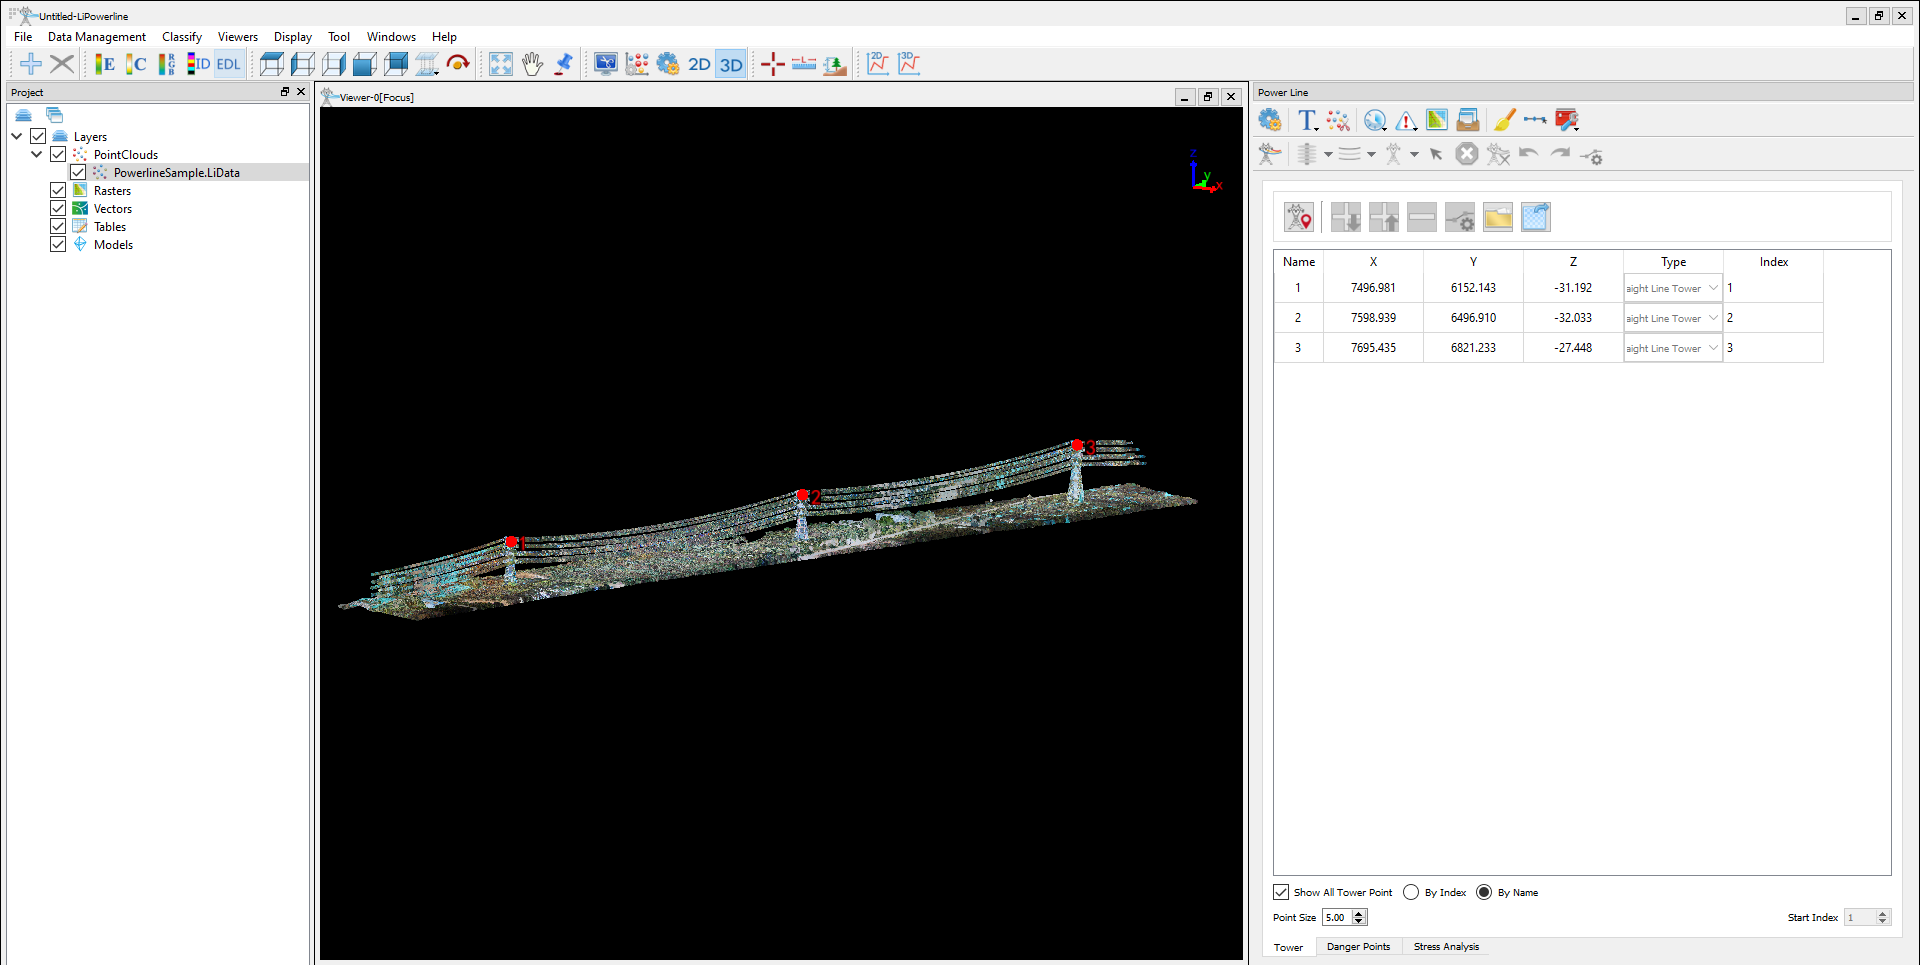
2.3 After finishing adding all tower locations, click Mark Tower ![]() again to stop editing. The tower location file tower.LiTower is saved automatically to the working directory.
again to stop editing. The tower location file tower.LiTower is saved automatically to the working directory.
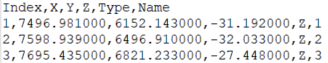
If vector file of tower locations exists, click Import Tower File
to import select and import the file. The format of .txt and .csv file should be as below with columns of Name, X, Y, Z, Type, Index. Type ‘N’ represents tension tower, and type ‘Z’ represents straight line tower.
3 Generate training samples
The software applies machine learning method for automatic classification of power lines and power towers. Before automatic classification, users need to generate training samples of power line, tower, ground, and other classes manually for further use in machine learning. At least one full span (everything between two power towers) is required for training sample. Please follow these steps to generate training samples:
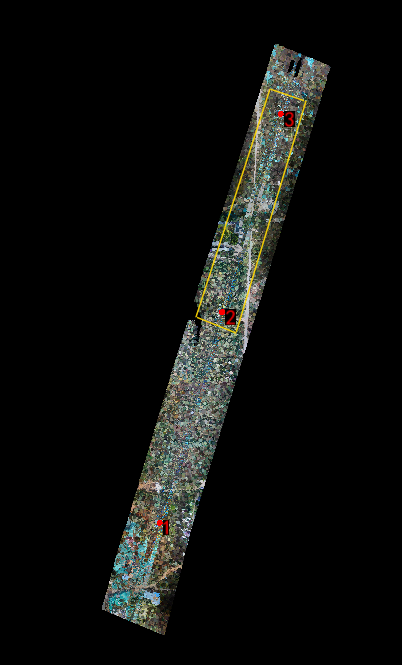
3.1 Identify one typical span of power line that is representative of the structures and environment in this project. In this exercise, we will use the span between tower 2 and tower 3:
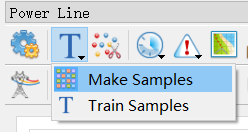
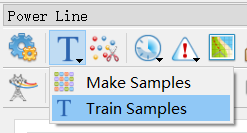
3.2 Click Train > Make Samples:
3.3 In Select Tools bar that popped up, click Polygon Selection ![]() .
.
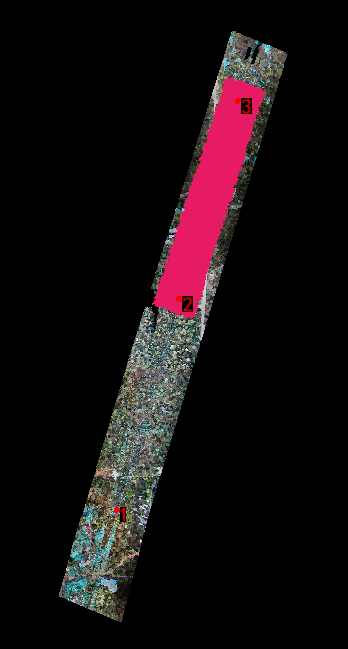
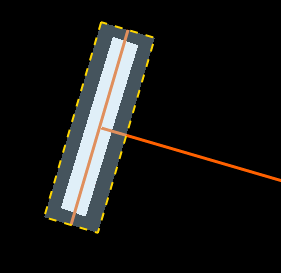
3.4 Click on the map to select the points in the span identified in Step a). Double-click to finish selecting. The selected points are highlighted:
3.5 Click In Cut ![]() to cut the point cloud:
to cut the point cloud:
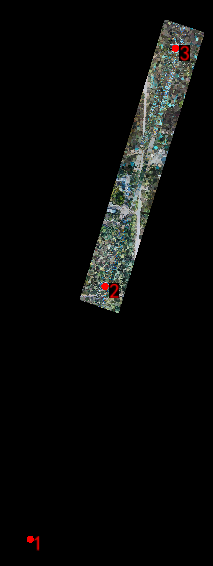
3.6 Click Save Cut ![]() , and change the output name to: CutResult.LiData. Click Yes in the ToolTip window to add the result to the view.
, and change the output name to: CutResult.LiData. Click Yes in the ToolTip window to add the result to the view.
3.7 In the Project window, uncheck the PowerlineSample.LiData layer.
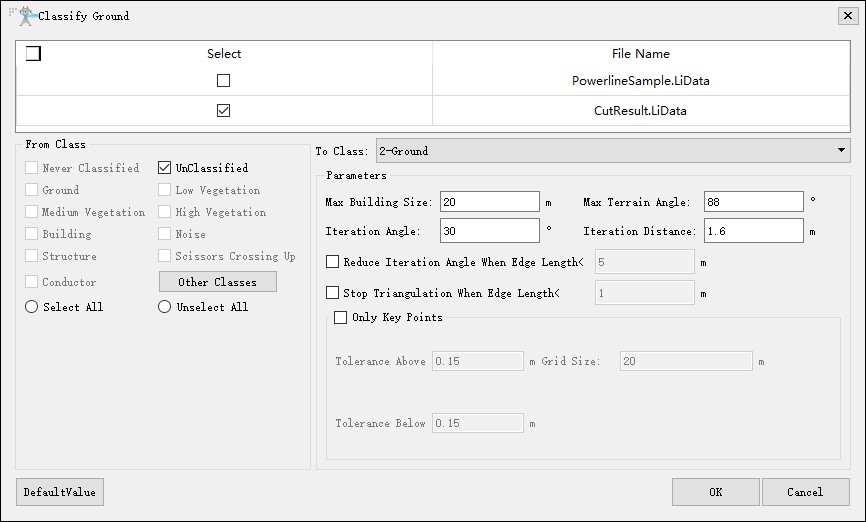
3.8 Classify the ground points: click Classify on top menu > Classify Ground. use the default parameter settings as below and click OK to run the tool.
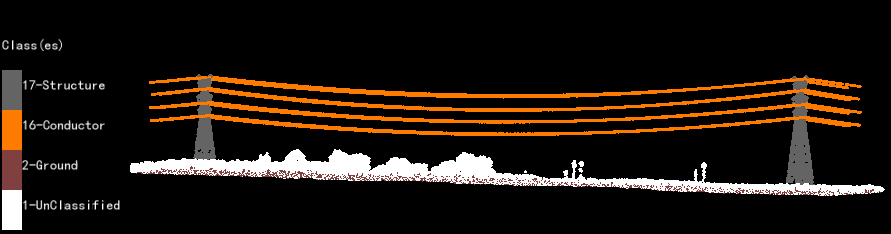
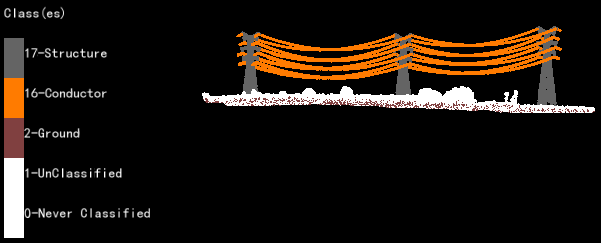
3.9 Click Display by Class ![]() . The classified ground points are displayed in brown, and other unclassified points are classified in white.
. The classified ground points are displayed in brown, and other unclassified points are classified in white.
3.10 Right-click on the CutResult.LiData layer > Zoom to Layer.
3.11 Classifying the power lines and towers manually: LiPowerline provides two manual classification mode: 2D Profile ![]() and 3D Profile
and 3D Profile ![]() . In 2D Profile mode, user select and classify points in a manual define 2D profile view, while in 3D Profile mode, user can rotate the point cloud in a 3D view to select and classify points in a proper perspective. Follow these steps to classify points into power lines and towers:
. In 2D Profile mode, user select and classify points in a manual define 2D profile view, while in 3D Profile mode, user can rotate the point cloud in a 3D view to select and classify points in a proper perspective. Follow these steps to classify points into power lines and towers:
3.11.1 Click 2D Profile ![]() . A new Profile window and Common Class Setting panel appears.
. A new Profile window and Common Class Setting panel appears.
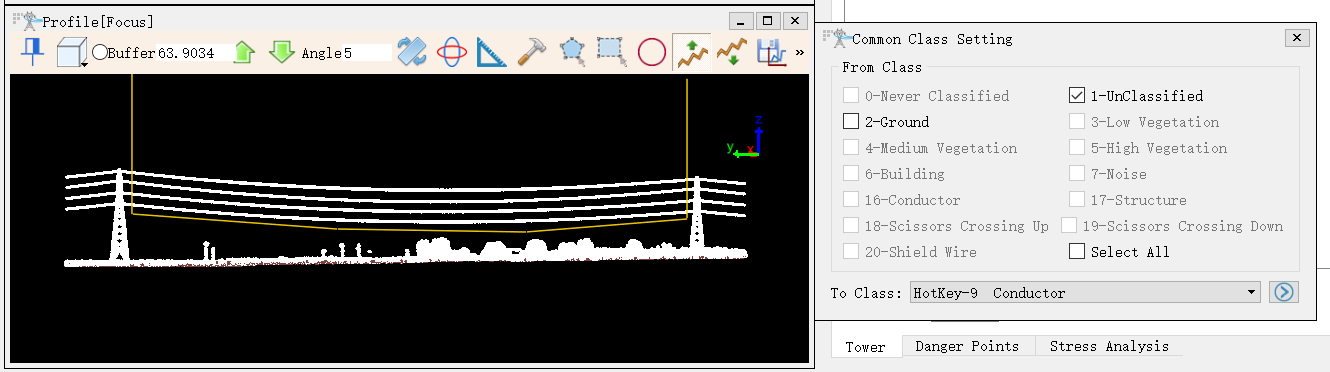
3.11.2 In the main Viewer window, single-click on outer side of the two towers to draw a line in the center along the power line span, and move the cursor up/down to adjust the buffer. Once all power lines in the span is included, double-click to finish defining the target area:
3.11.3 In the Common Class Setting panel, check ‘1-Unclassified’ as From Class, and select ‘Conductor’ as To Class.
In your own project, if the point cloud dataset has never been classified, the class for all points would be ‘0-Never Classified’. In that case, select ‘0-Never Classified’ as From Class.
3.11.4 Use the Select tools ![]() to select power lines in the Profile view. The points that are selected will be changed into a new color:
to select power lines in the Profile view. The points that are selected will be changed into a new color:
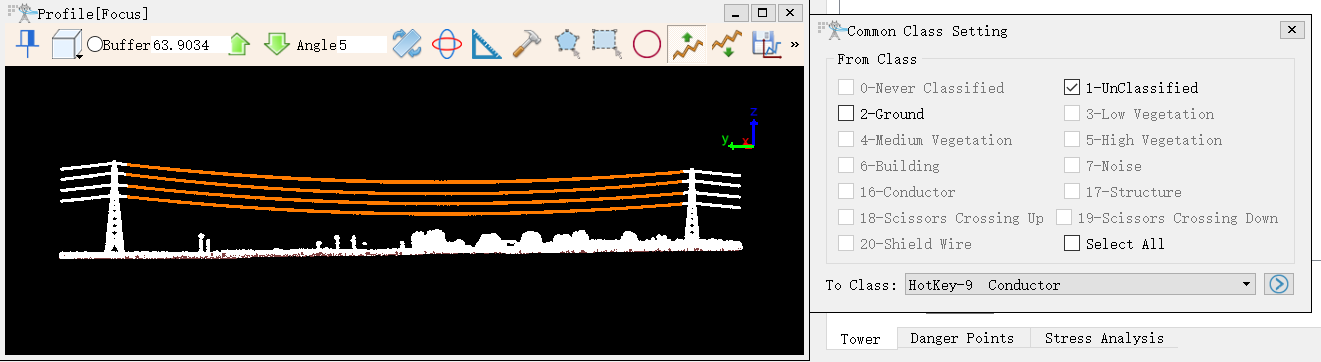
Since further edits will be made in the following steps, don’t worry about selecting all power line points in this step.
3.11.5 Click Save Results ![]() to save the classification, and close the 2D Profile view window.
to save the classification, and close the 2D Profile view window.
3.11.6 Click 3D Profile ![]() to open the 3D Profile view. Move and rotate the point cloud in the 3D viewer, and use Polyline Above Selection, Polyline Below Selection, Polygon Selection, Rectangle Selection, and Circle Selection tools to select and classify the unclassified power line and power tower points. You may switch back and forward between the 2D Profile mode and 3D Profile mode to classify the points.
to open the 3D Profile view. Move and rotate the point cloud in the 3D viewer, and use Polyline Above Selection, Polyline Below Selection, Polygon Selection, Rectangle Selection, and Circle Selection tools to select and classify the unclassified power line and power tower points. You may switch back and forward between the 2D Profile mode and 3D Profile mode to classify the points.
4 Train the samples
4.1 In Power Line window, click Train > Train Samples:
4.2 In the Classify of Training tool window, select CutResult.LiData as Input Training File, and remove PowerlineSample.LiData from Input Training File if it is listed, set output file as TrainingResult.cm in the working directory. Click OK to run the tool.
4.3 Remove the CutResult.LiData from Project.
5 Clip and classify
5.1 In Power Line window, click Clip and Classify ![]() .
.
5.2 In the Clip and Classify window, click Options to expand the Advanced Parameters. Adjust the parameters as needed. In this exercise, make sure the values are as below:
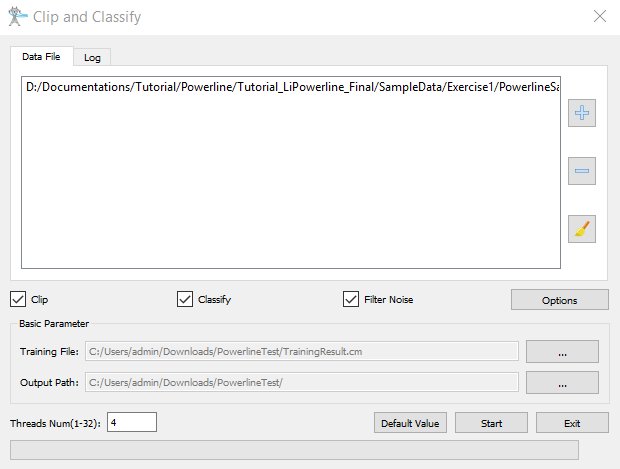
5.3 Clip Start to start processing.
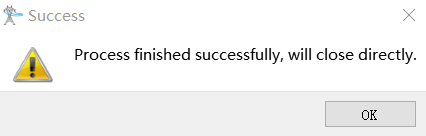
5.4 Click OK in the Success window when finished:
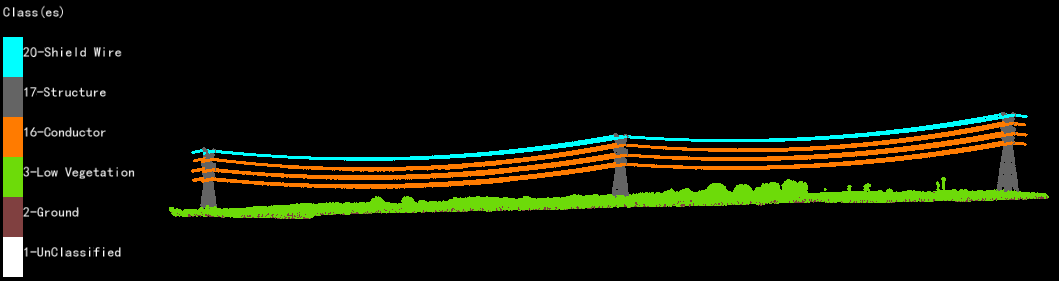
5.5 Add the clipped and classified point cloud datasets, 1-2(1_2).LiData and 2-3(2_3).LiData, to LiPowerline. Notice that power lines and power towers are now classified in different classes.
5.6 For the points classified incorrectly, use the 2D Profile and 3D Profile tools to manually reclassify them into correct classes.
Classifying shield wires and vegetation
Using Machine Learning, we have successfully classified the power towers and power lines. Above we classified the two shield wires on the top as ‘Conductor’. Next, we will reclassify them back to ‘Shield Wire’. Further, notice that the majority landscape is covered by low vegetation in this sample dataset, we will classify the landscape points into ‘Low Vegetation’.
1 Classify shield wires
1.1 Use 2D Profile or 3D Profile tool to classify the two shield wires on the top from ‘Conductor’ to ‘Shield Wire’. Save the classification result.
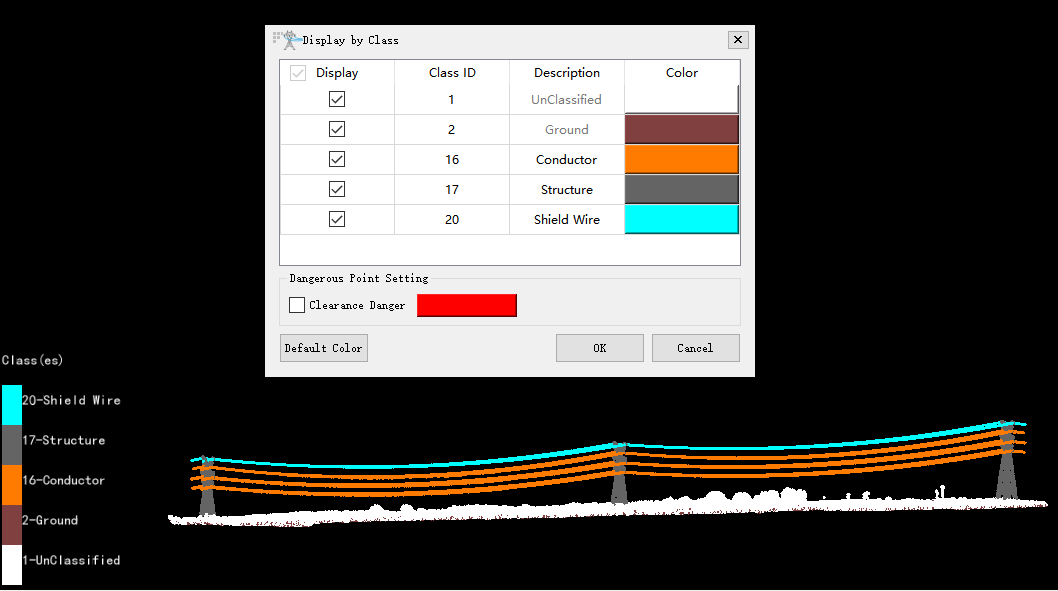
1.2 The default display color for ‘Shield Wire’ is the same as ‘Conductor’. Click Display by Class ![]() in Display toolbar, and change the display color for ‘Shield Wire’ to blue:
in Display toolbar, and change the display color for ‘Shield Wire’ to blue:
2 Classify vegetation
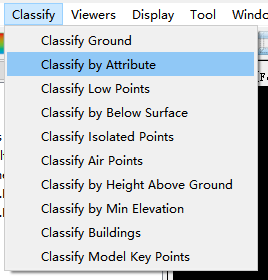
2.1 Click Classify in toolbar > Classify by Attribute:
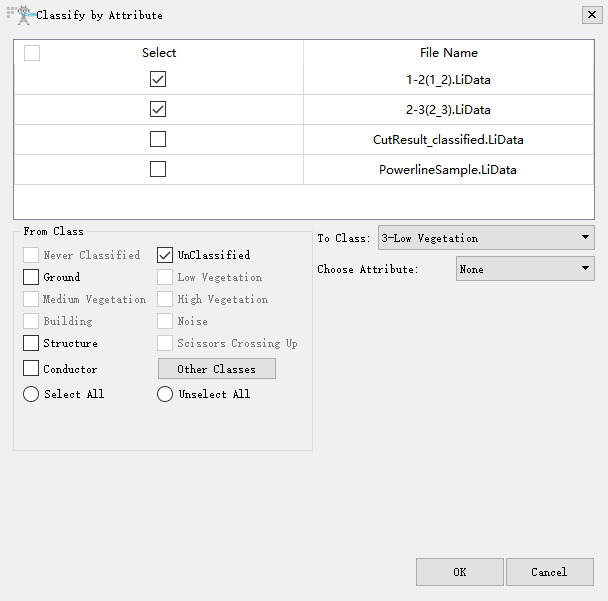
2.2 For input dataset, select 1-2(1_2).LiData and 2-3(2_3).LiData; From Class: ‘Unclassified’; To Class: ‘3-Low Vegetation’. Click OK to run the tool.
This process classifies all the unclassified points into ‘Low Vegetation’.
Vectorizing power infrastructures
After classification, we will vectorize the insulators, power lines, and towers to generate complete power infrastructure objects, and export them as vector file (.shp) for further analysis.
1 Vectorize insulators
1.1 Click Vectorization Editing ![]() in the Power Line panel to activate the vectorization editing tools.
in the Power Line panel to activate the vectorization editing tools.
1.2 Click Insulator Editing ![]() to open the insulator vectorization toolbar.
to open the insulator vectorization toolbar.
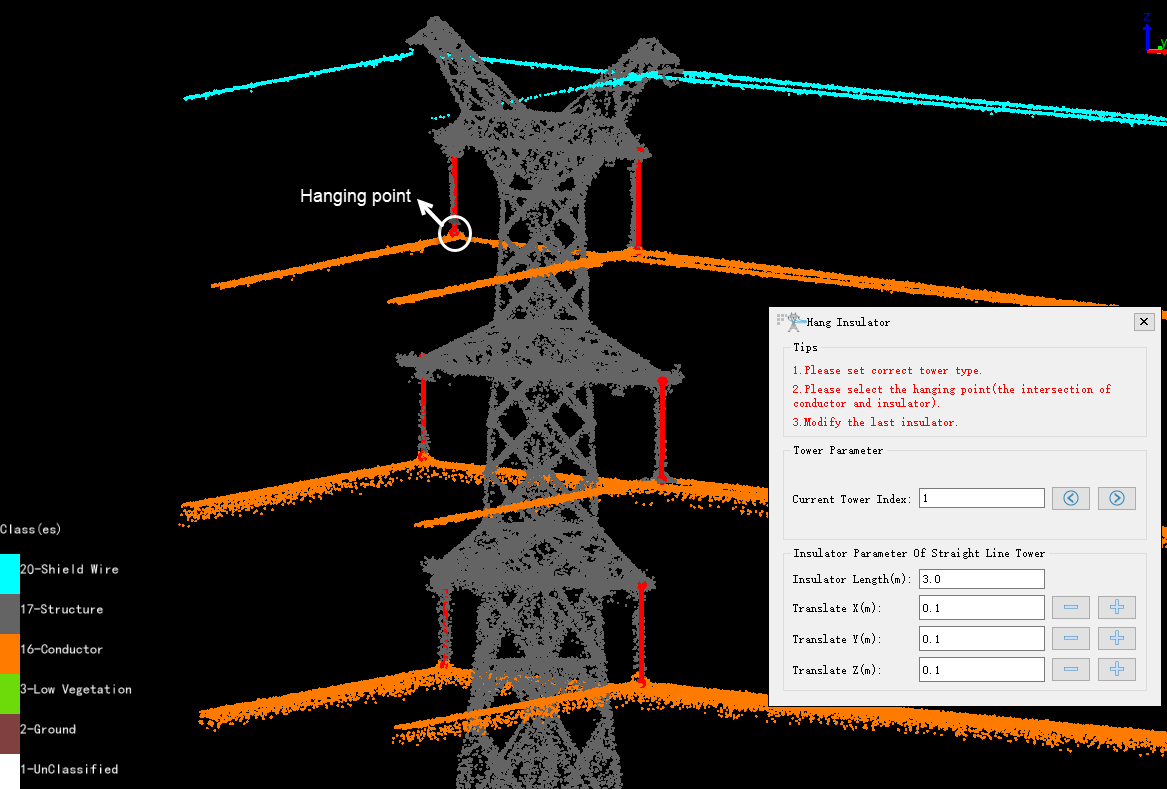
1.3 Click Hang Insulator ![]() . The Hang Insulator dialog window opens.
. The Hang Insulator dialog window opens.
1.4 Enter the tower index, 1, and press Enter key on keyboard to locate Tower1.
1.5 Use the Length Measurement ![]() tool in LiPowerline toolbar to measure the length of the insulator. In this project, the length of all insulators is 3 meters. Enter 3 in Insulator Length (m).
tool in LiPowerline toolbar to measure the length of the insulator. In this project, the length of all insulators is 3 meters. Enter 3 in Insulator Length (m).
1.6 Left-click to select the hanging point between insulator and powerline to create the insulator vector object.
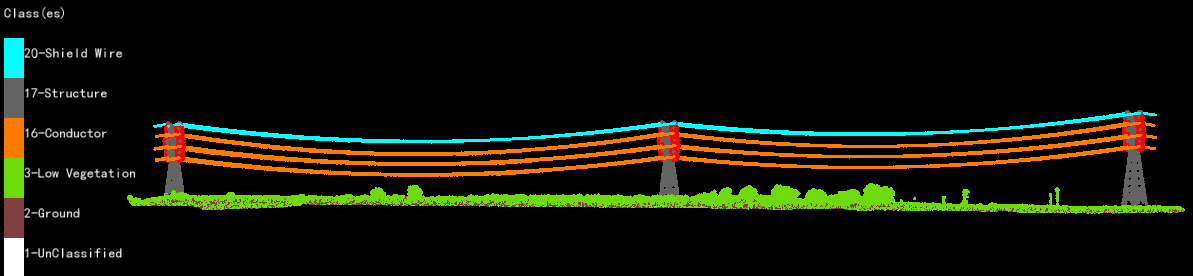
1.7 Continue this process to finish vectorizing all insulators on 3 powers. There are 6 insulators on each tower in this project.
1.8 Click on Insulator Editing ![]() again to stop editing.
again to stop editing.
2 Vectorize power lines
2.1 Click Power Line Editing ![]() to open the power line vectorization toolbar.
to open the power line vectorization toolbar.
2.2 Click Batch Fitting Power Lines ![]() . In the Batch Vectorization dialog window, accept the default number of 1 Powerline splits number, and click Start to run the tool. All powerlines between insulators are vectorized automatically.
. In the Batch Vectorization dialog window, accept the default number of 1 Powerline splits number, and click Start to run the tool. All powerlines between insulators are vectorized automatically.
The two shield wires are not vectorized, since they are not involved in the analysis in the following exercise. If shield wire vectorization is necessary in your own project, you can use the Three Points Fitting Single Power Line
tool to vectorize the shield wires.
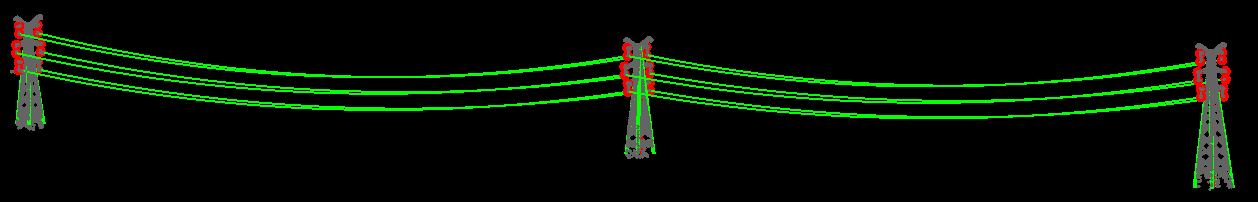
2.3 When finished, vector lines are created and colored in green. Turn on and off the ‘Conductor’ class display in Display by Class tool, and check the fitting quality.
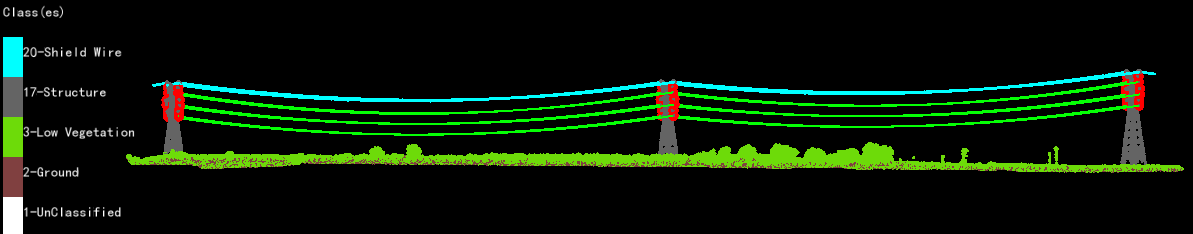
2.4 Click Save As ![]() to save the generated power lines as shapefile Powerline.shp.
to save the generated power lines as shapefile Powerline.shp.
3 Vectorize power towers
To create tower vector objects, tower templates need to be created first. In LiPowerline, user can use the Create Tower From Five Points tool to create the template, and use this template to generate tower vector objects with one-click for other towers.
3.1 Click Tower Editing ![]() to open the tower vectorization toolbar.
to open the tower vectorization toolbar.
3.2 Click Create Tower From Five Points ![]() . This tool generates tower using the bottom 4 points and the top 1 point specified by user.
. This tool generates tower using the bottom 4 points and the top 1 point specified by user.
3.3 Click Display by Class on toolbar, and uncheck all other classes except for ‘Structure’ to turn off display of other classes. Click OK.
3.4 Zoom to Tower1.
3.5 Left-click to select the bottom corner 1, 2, 3, and 4 of Tower1 sequentially, and left-click to select the top point of the tower to finish creating one tower model. At any time, you could right-click to end and discard the editing.
3.6 Right-click and select Finish Draw Power Tower to complete creation of all tower models.
3.7 Click Create Cross Arm ![]() to add arms to the tower.
to add arms to the tower.
3.8 Left-click on the tower first, then click to select the end point 1 of the first tower arm, and click to select the end point 2 of the arm.
3.9 Repeat this process to finish adding all three arms.
3.10 Right-click and select Finish Draw Power Tower Arm.
3.11 Click Modify Tower ![]() .
.
3.12 Left-click the tower created above. The Modify Tower dialog window opens.
3.13 Type in a name for this tower in the Description: Tower1. Click Apply.
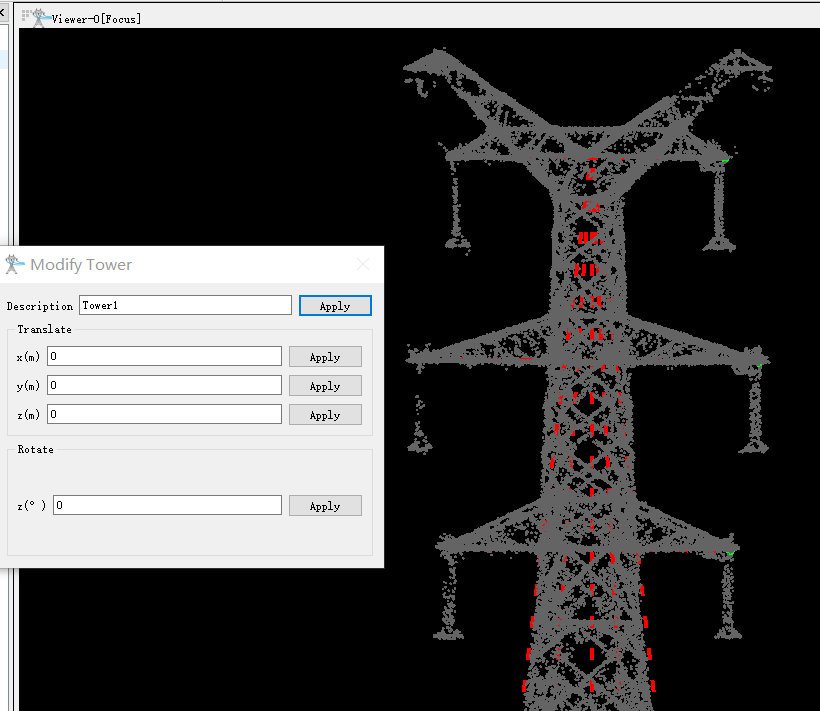
3.14 Right-click to finish modifying.
3.15 Click Save Tower Template ![]() , and save as tower1.tow.
, and save as tower1.tow.
3.16 Click Load Tower Template ![]() , and select the tower1.tow template file to load to the project.
, and select the tower1.tow template file to load to the project.
3.17 Zoom to Tower 2, click Place Tower ![]() , and click on the top of Tower2. In Place Tower dialog window, select Tower1 as Tower Type. Click OK to finish placing the tower.
, and click on the top of Tower2. In Place Tower dialog window, select Tower1 as Tower Type. Click OK to finish placing the tower.
3.18 Click Modify Tower ![]() , and type in Tower2 in Description. Click Apply.
, and type in Tower2 in Description. Click Apply.
3.19 Zoom to Tower 3. Notice that Tower 3 is taller than Tower 1 and Tower 2. Therefore, repeat step 3.2 to step 3.14 to create Tower 3 model.
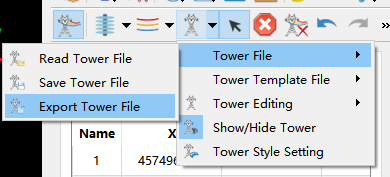
3.20 Click Tower Editing > Tower File > Export Tower File, to save the tower models as shapefile: Towers.shp.