Exercise 2. Independent Variables
In regression analysis, commonly used independent variables are average elevation, maximum elevation, minimum elevation, elevation percentiles, and coverage rate, among which elevation percentile is most often used.
Elevation percentile: Within a statistical unit, all normalized lidar point clouds are sorted by elevation, and then the elevation at which X% of points in each statistical unit is located is the elevation percentile of this statistical unit. The Elevation Metrics tool in LiDAR360 calculates 15 elevation percentiles: 1%, 5%, 10%, 20%, 25%, 30%, 40%, 50%, 60%, 70%, 75%, 80%, 90%, 95% and 99%.
This exercise covers the process to calculate Elevation Metrics in LiDAR360. The point cloud on which to calculate Elevation Metrics needs to be normalized first.
- Add ALSData.LiData to LiDAR360.
- Go to Classify > Classify Ground Points. Use default settings and click OK to run the tool. Please refer to user guide for detailed introduction of the tool and parameter settings.
- Go to Data Management > Point Cloud Tools > Normalize by Ground Points.
Go to ALS Forest > Forest Metrics > Elevation Metrics to access the following dialog window.
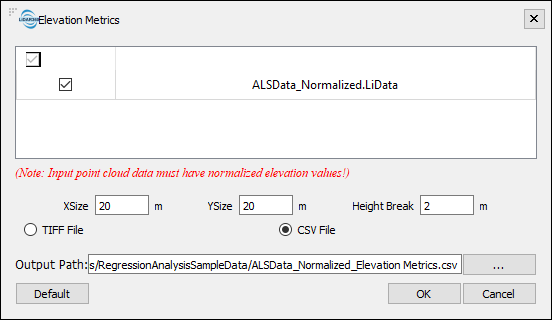
- XSize/YSize: The point cloud will be split into grids in the size of X by Y, which are the units for calculating statistical parameters in Elevation Metrics tool. XSize/YSize also define the spatial resolution of the Regression Analysis output. Generally, XSize/YSize are set to be the same or close to the size of the survey plots on which sample data was collected. In this tutorial, the survey plots on which sample data was collected are circular plots of 10m radiuses. Therefore, XSize and YSize in this case are set to 20m.
- Height Break: A height break value to define trees. Points below this value are not treated as trees and will not participate in metrics calculation. Default value is 2m.
- Output formats: If set to TIFF File, resulting outputs will be saved as TIFF files, one for each variable, in a new folder named after the point cloud file; if set to CSV File, a CSV file will be created instead at the set path. Both TIFF File and CSV File can be used as Independent Variables in the Regression Analysis tools. In this exercise, select CSV File.
Click OK to run the tool.