Subscribe

How to measure tree diameter with DGC50H?

-- 12 Jan 2024 --

Carry out path planning for the collection sample area, taking the 30m*30m forestry tree quadrat as an example. The purpose of route planning is to collect all information about the trees while reducing data redundancy. For the 30m*30m sample area, if the trees are relatively dense, Use the path planning shown on the up side of the picture below. If the trees are sparse, you can use the path planning shown on the down side of the picture below:

图片1.png 

Dense trees


图片2.png 

sparse trees               

Figure 1 Path planning

(Note: The path planning in this case is only for reference. Due to different actual operating environments, appropriate modifications can be made)


Data collection


After the path planning is completed, carry LiBackpack for data collection:

(1) Connect the mobile device to the LiBackpack computer hotspot;

(2) Click the start button on the device to start data collection, and perform data collection operations according to the set path plan;

(3) After reaching the end point, click the stop button to end the collection, plug in the USB flash drive, and click the copy button to export the collection results.

After the collection is completed, the following data files are included:

bag: original data file, which can be used to solve high-precision point cloud data;

ply: real-time point cloud file;

xyz: real-time processed trajectory file, including the relative coordinates of the walking trajectory;

log: original GNSS observation file. You can upload this file and base station file to LiCloud, and return the trajectory coordinates through cloud processing. The returned coordinates can enable the point cloud to obtain absolute coordinates during the solution process;

mp 4 : Panoramic image file, which can color the point cloud during the solution process.


 图片3.png 

Field data collection

图片4.png
Real-time point cloud 


Data Processing

After the data collection is completed and copied to the computer, the point cloud calculation software LiFuser-BP provided with the LiBackpack DGC50H device is used to process the point cloud data and obtain high-precision point cloud data with absolute coordinates. 


1705044095208.jpg
Figure 3 Point cloud, trajectory and panoramic image after completion of solution


Data processing flow

7.jpg


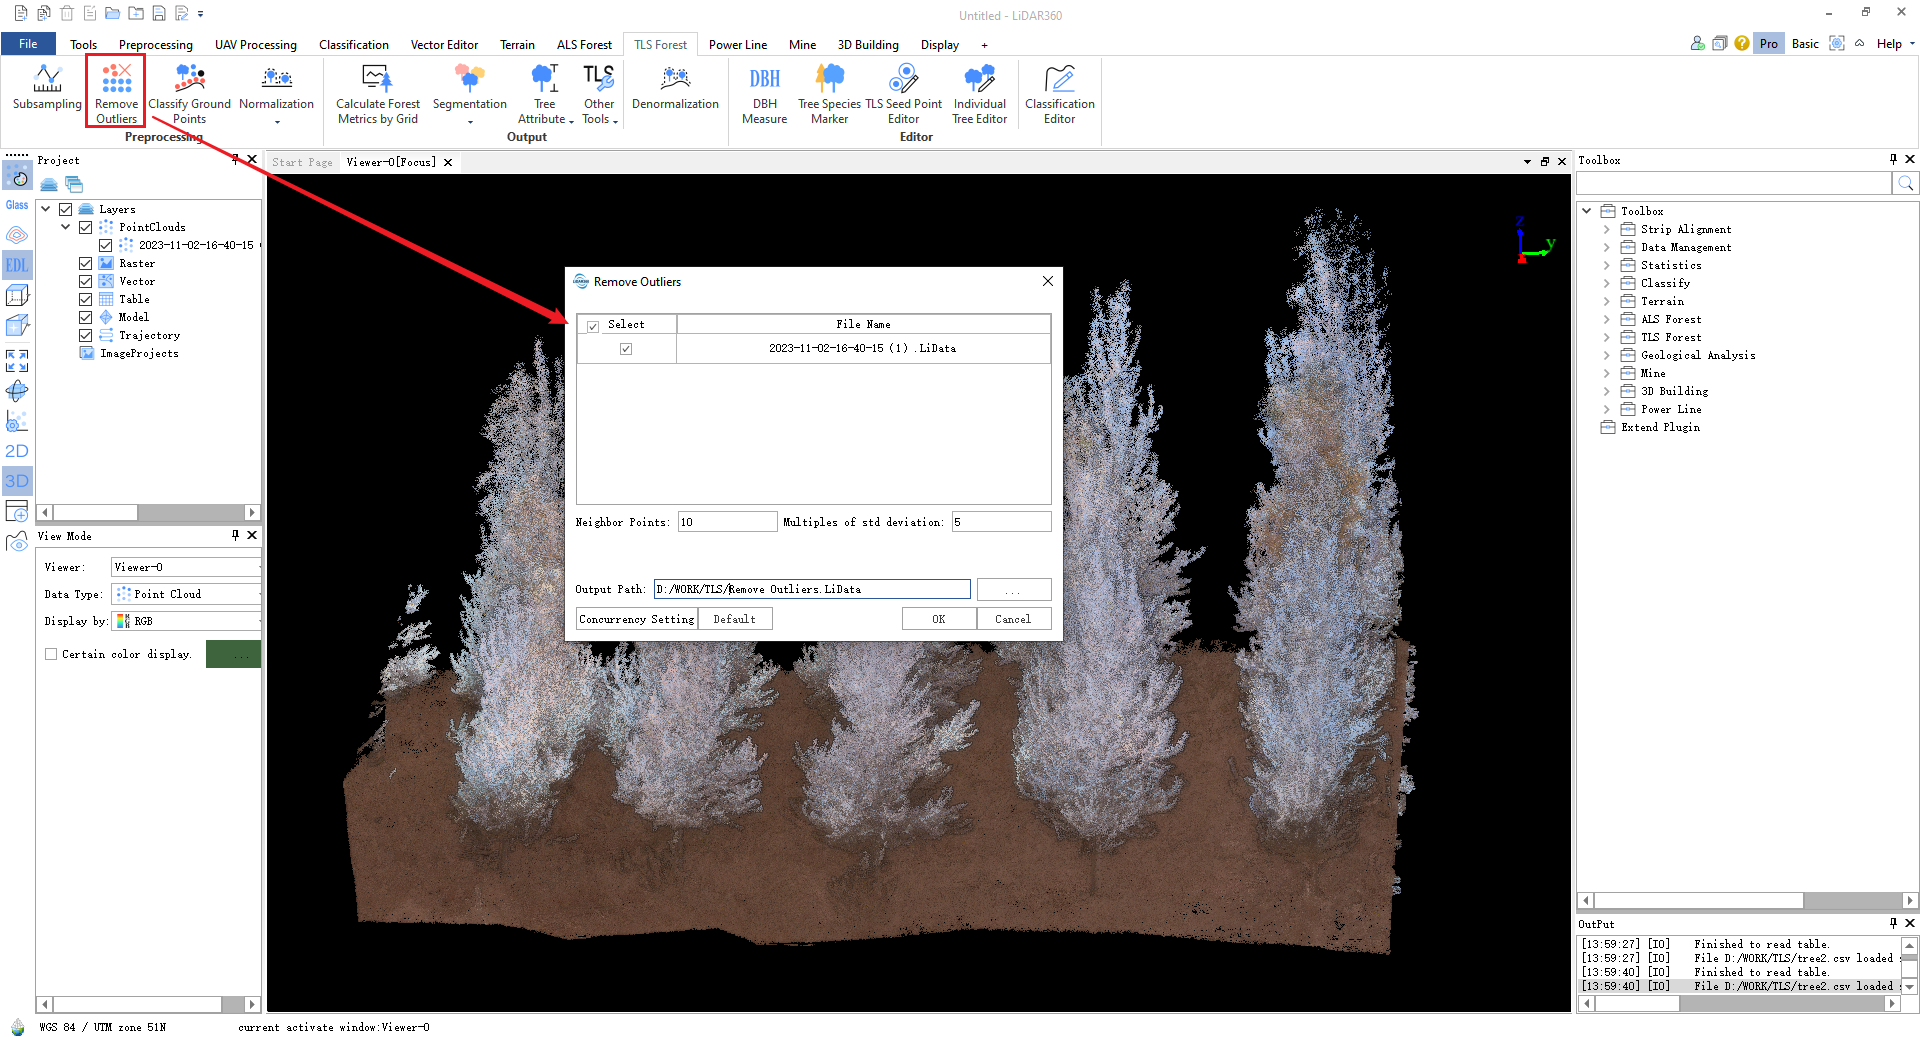
(1) Denoising

If the data collected in the field has a lot of noise, it will affect the extraction of single tree parameters. At this time, the denoising function of LiDAR 360 can be used to remove the noise in the data and improve the quality of the point cloud data.
 图片7.png

Figure 5  Denoising

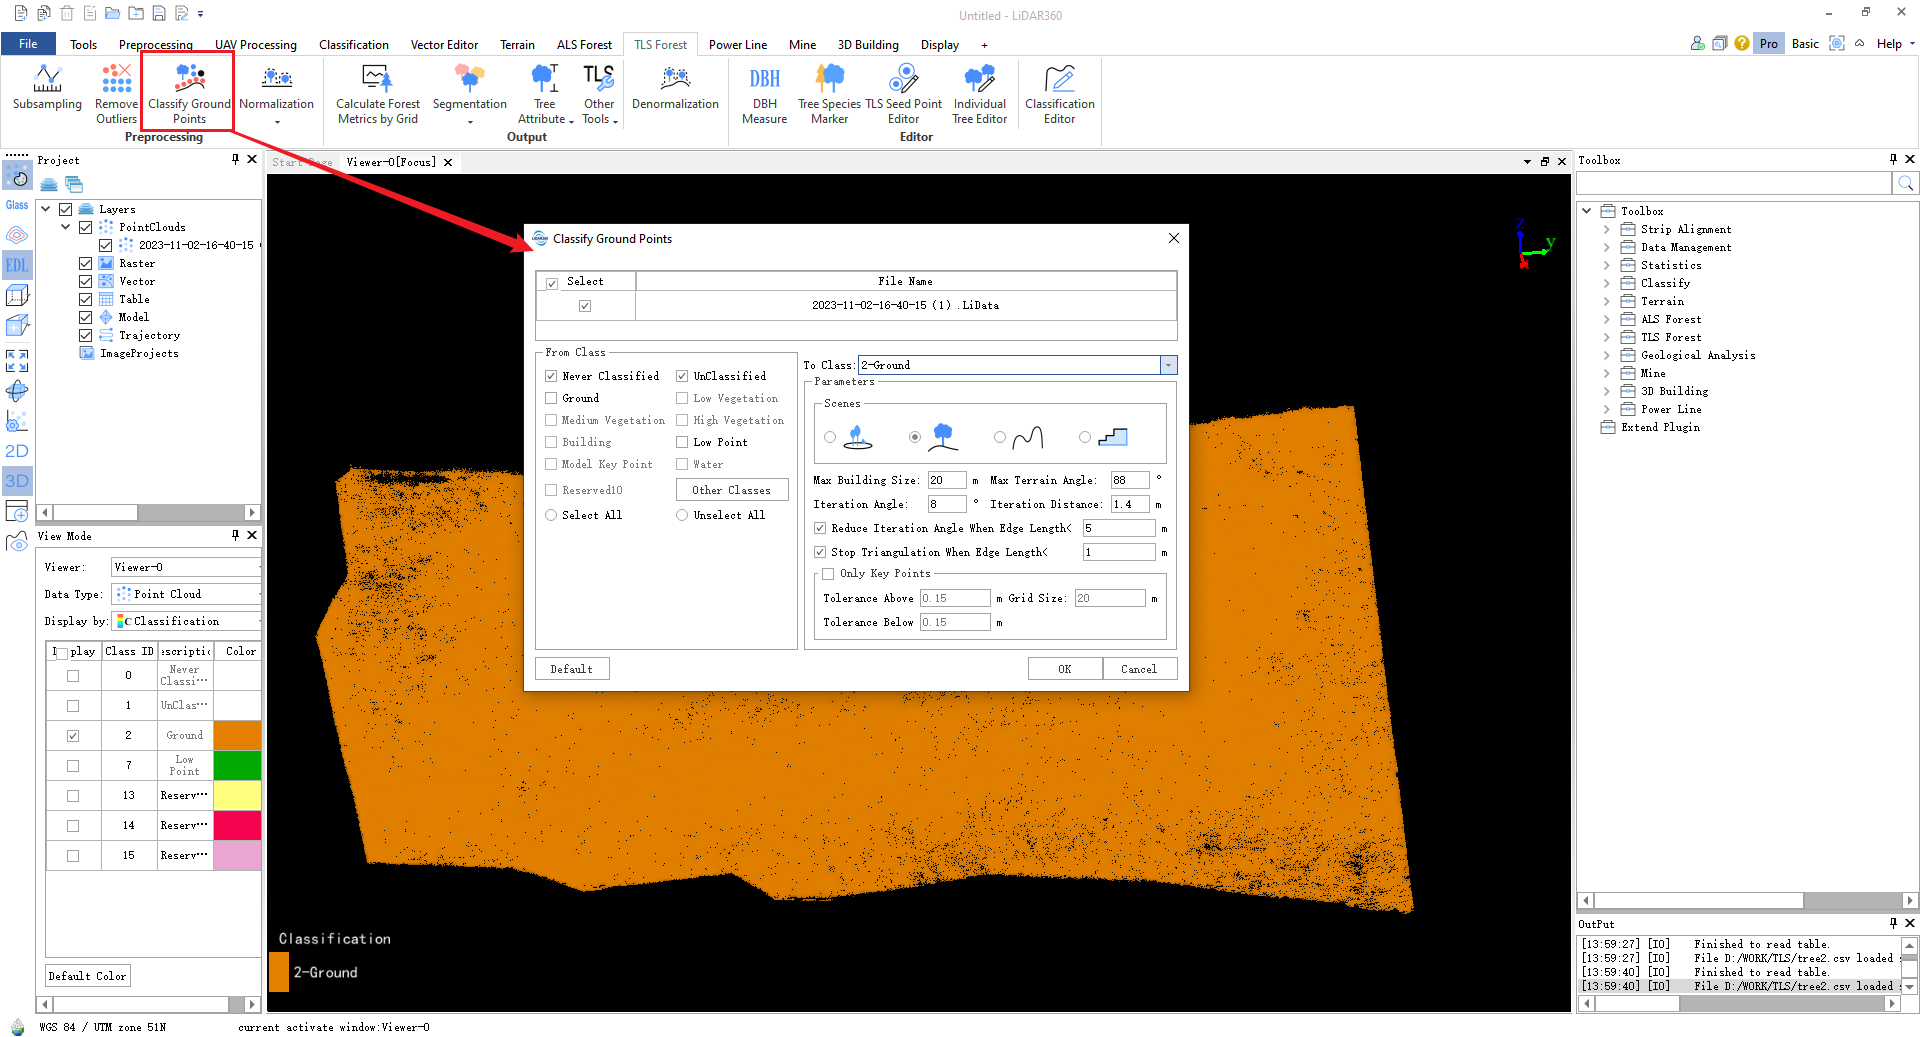
(2) Ground point classification

Ground point classification is the basis of ground forestry and can be used as a benchmark for tree height. The LiDAR 360 ground point classification function includes four ground point classification scenarios: flat land, gentle slopes, steep slopes and hills.
 图片8.png

Figure 6 Ground point classification

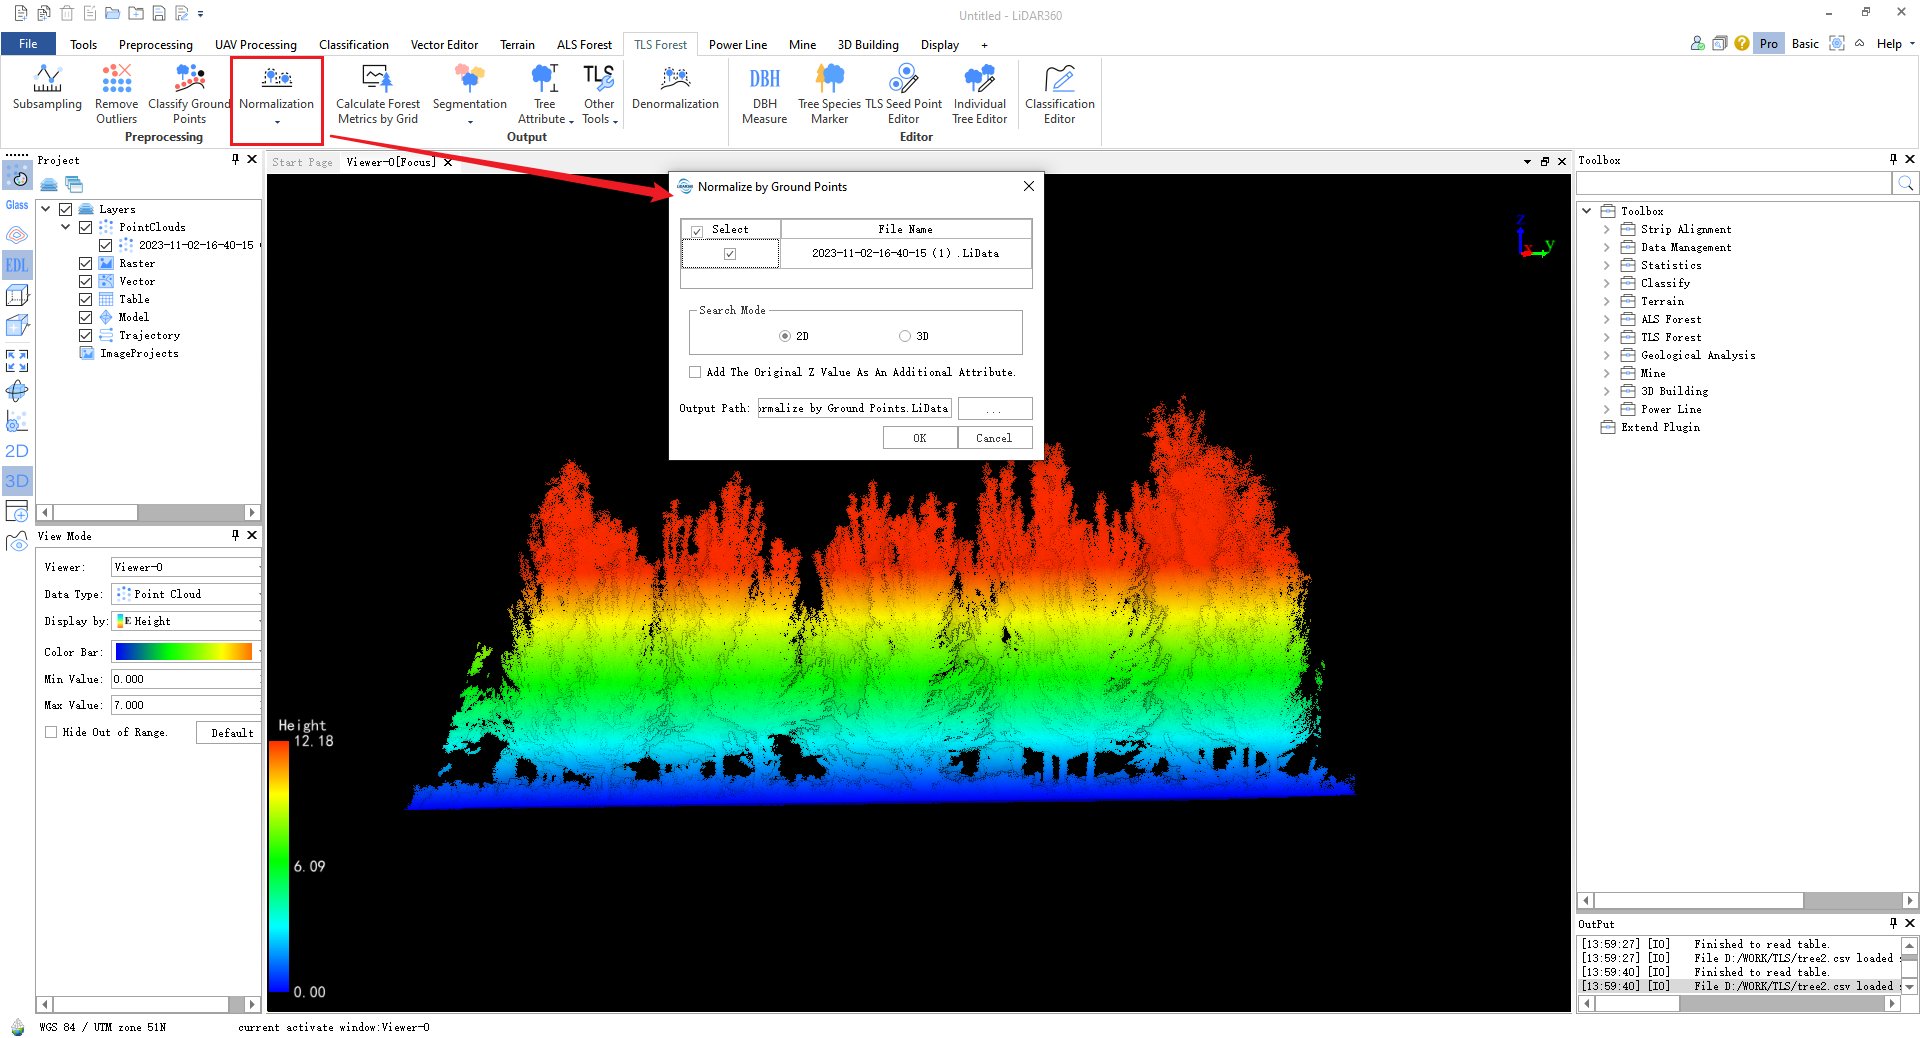
(3) Normalization

Normalization can remove the influence of terrain relief on forestry data, and the normalized ground point elevation is 0.

图片9.png 

Figure 7 Normalization _

(4) Extract single tree diameter at breast height (extract seed points)

If you only want to extract the diameter at breast height of a single tree, you can directly use the TLS seed point editing function. The software supports extracting the diameter at breast height of a single tree and batch extraction. The extracted diameter at breast height of a single tree will be viewed in the attribute table below. At the same time, the software will Diameter at breast height is evaluated for confidence. The confidence level is divided into three levels: high, medium and low, which correspond to the yellow, purple and red colors displayed by the seed points respectively. Yellow has the highest confidence, purple comes next and red is the lowest.
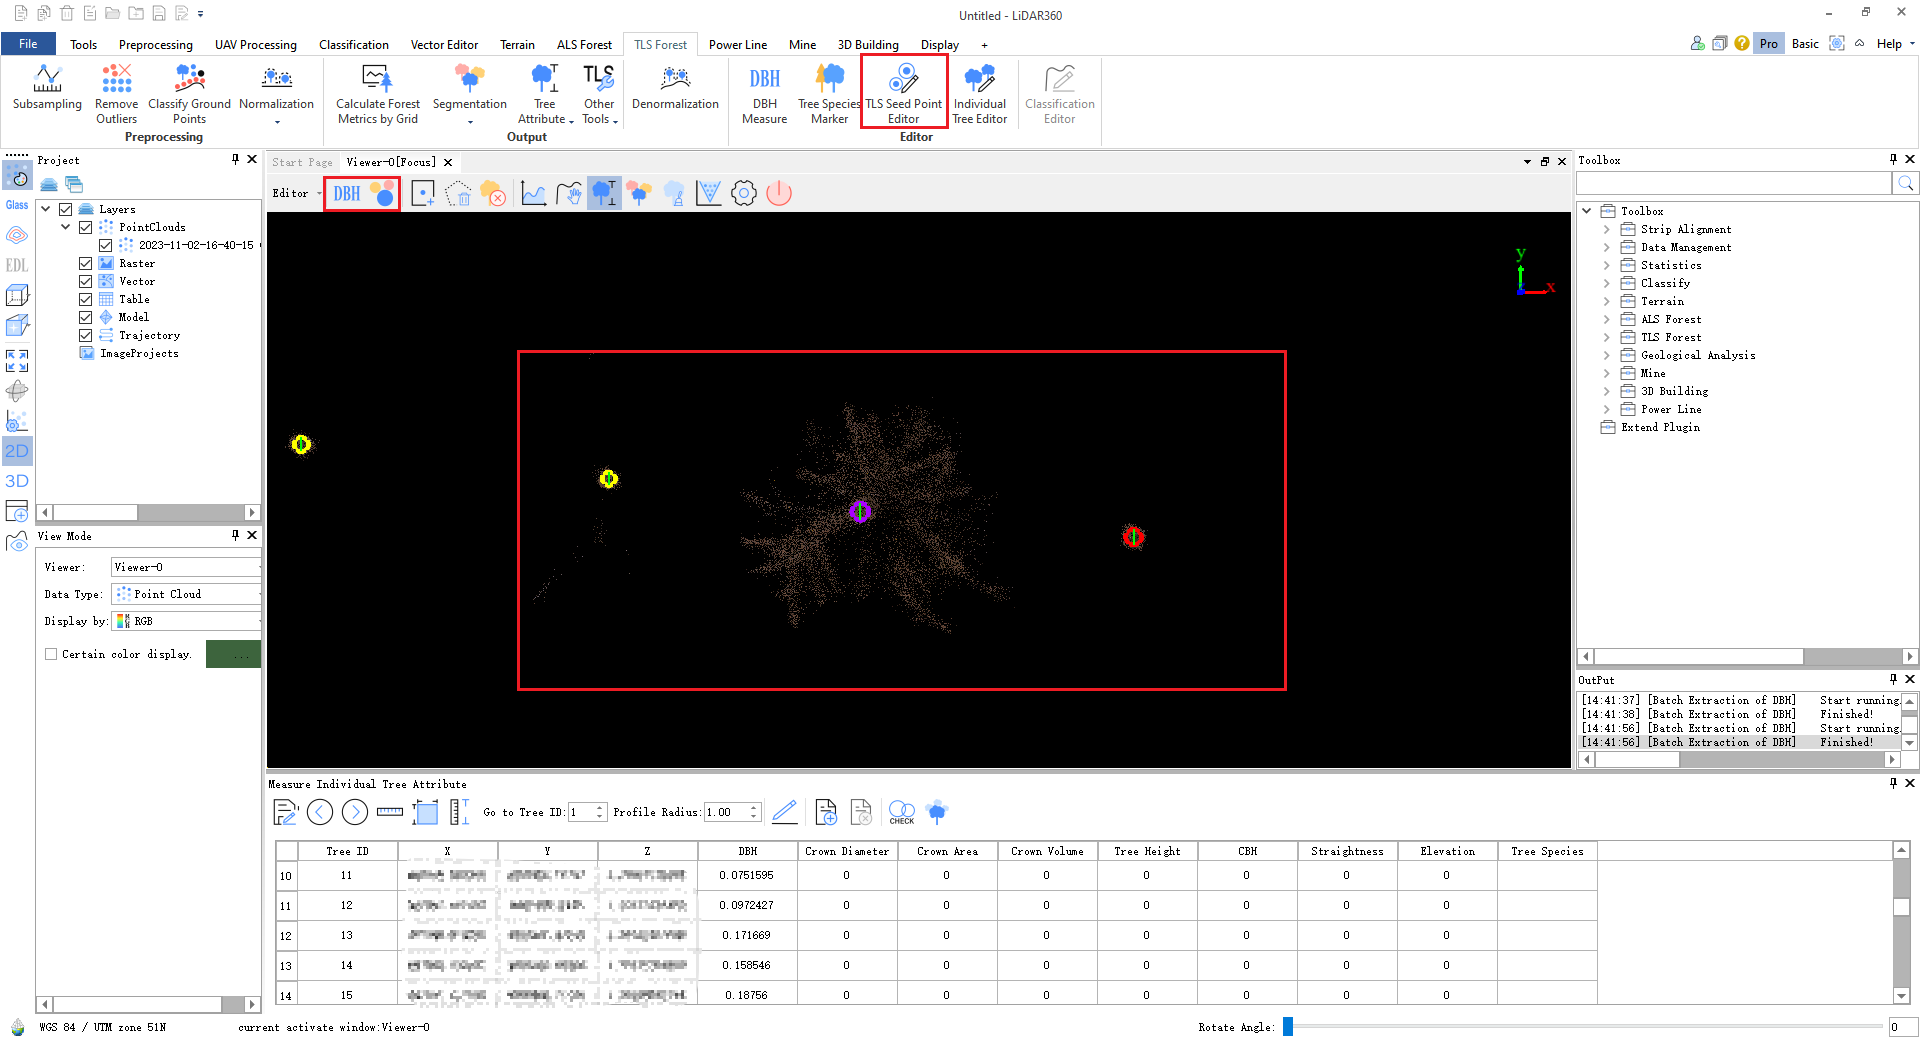

图片10.png  Figure 8  Extracting the Tree Diameter

(5) DBH examination

Check the fitting results through the profile, and delete and refit the DBH results with incorrect fitting and delete and refit the D BH results with incorrect fitting.
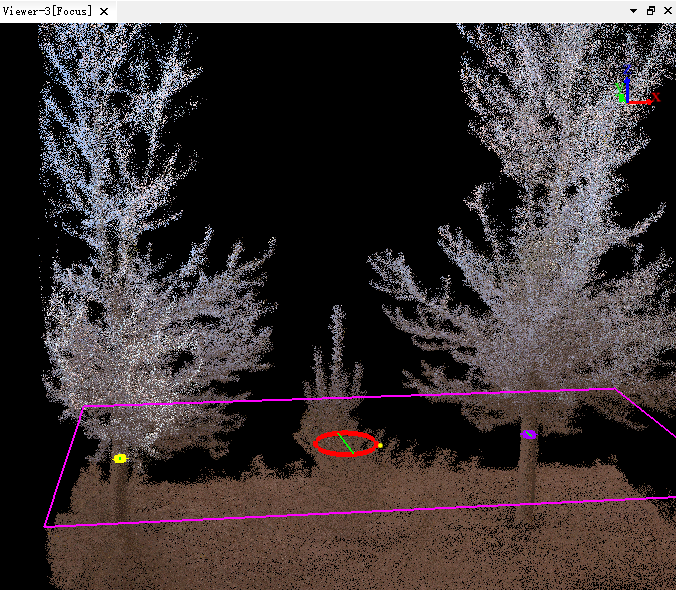

图片11.png 

Before fixing

图片12.png 

After modification


Figure 9  Chest diameter inspection and modification

(6) Save seed points

After confirming that the diameter at breast height is correctly fitted, you can click Save to save it in treedb or csv format. The file saved at this time is also a seed point file, including the location information of the tree and DBH.


图片13.png Figure 10   Saved seed points and their attribute table

(7) Single wood segmentation

If you want to extract other single tree parameters such as tree height, crown diameter, crown area, etc., you also need to perform single tree segmentation. After turning on the single tree segmentation function based on seed points, you can set the following parameters:

✱Point cloud file: normalized point cloud;

✱Seed file: the seed point saved in the previous step;

✱Select category: the category of vegetation to be divided;

✱Clustering threshold: Controls the efficiency and accuracy of single tree segmentation. The larger the clustering threshold, the higher the efficiency of single tree segmentation, but if it is too large, it will affect the segmentation effect;

✱Minimum number of clustering points: affects the growth of single tree canopy point clouds. The smaller the value, the higher the segmentation accuracy, but the longer the time;

✱Minimum/maximum D BH : Limit the fitting D BH elevation range;

✱Point height above the ground: Only point clouds above this height can participate in single tree segmentation;

✱Minimum tree height: During the segmentation process, trees with a tree height lower than this value will not be used as the result of segmentation;

✱Optimize the display color matching of single wood segmentation results: after segmentation, adjacent single trees are distinguished by different colors.

 图片14.png

Figure 11 Single wood segmentation interface based on seed points

 图片15.png

Figure 12 Single wood segmentation results

图片16.png Figure 13 Split attribute table


Recommended Articles

HOW CAN WE HELP YOU?
Message us your questions and contact information.
We’ll get back to you right away!