Subscribe

Filling the Point Cloud Gaps with LiDAR360

-- 21 May 2021 --

Aligning 3D Data Captured from UAV and Handheld Mobile Laser Scanning Platforms to Fill Data Holes


3D point clouds constructed from multiple laser scanning platforms, such as mobile handheld and UAV LiDAR systems, can provide comprehensive spatial descriptions of objects or regions of interest that would be difficult to generate using just a single laser scanning platform.


Next Generation LiDAR Surveying and 3D Mapping Solutions


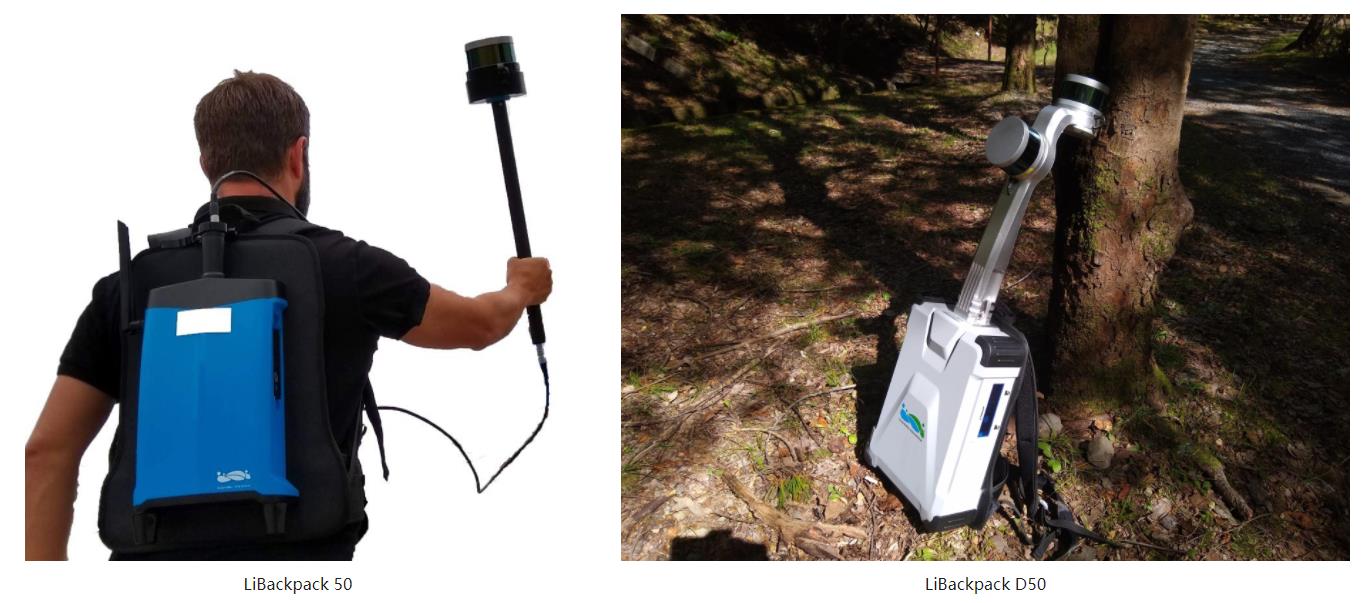
For the past few decades, 3D laser scanning technology options have included expensive fixed-wing and helicopter airborne payloads as well as static terrestrial systems that can be cumbersome to operate and require a great deal of post-survey data processing effort. In more recent times, the suite of laser scanning options has grown to include more cost effective and easier to use UAV LiDAR collection devices like GreenValley International’s LiAir or the firm’s handheld and wearable mobile laser scanning LiBackpack solutions. 

01.jpg


LIDAR Data Gaps are the Worst


Many producers and consumers of LiDAR data know all too well the frustrations that arise from having regions of no data in their 3D point clouds; otherwise known as data holes. Data holes occur where an object or surface with a mappable spatial structure can be found however was occluded from the surveying instrument(s) field of view during data collection. Information gaps of this type present troublesome or debilitating quality issues during the development of project deliverables or the running of operations that make use of laser scan data.


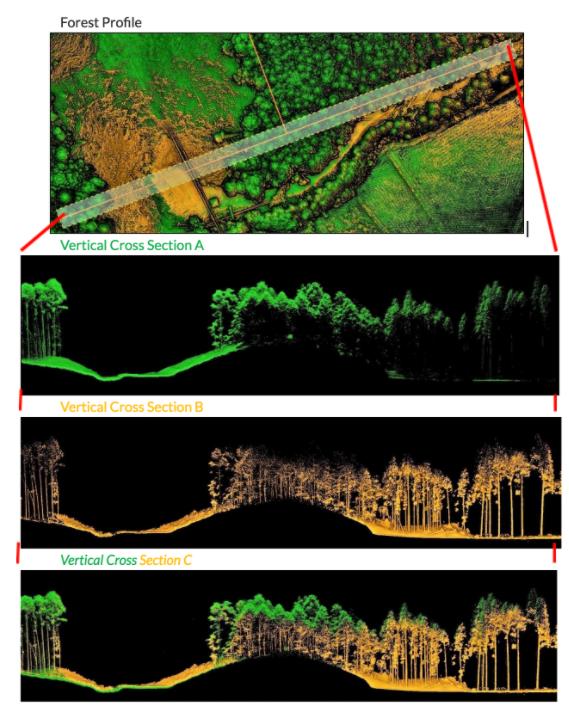
All laser scanning platforms have limitations that can lead to the formation of data holes. For example, airborne and UAV LiDAR point clouds often lack measurement data in the sub-canopy regions of forested areas which can preclude these data types from use in the determination of stem diameters and canopy base heights - individual tree metrics that are key to estimating timber volumes and biomass using allometric equations. Conversely, ground-based terrestrial or mobile LiDAR systems capable of capturing the tree stems and forms can miss the top-sides of forest canopies and tree heights, which are also key attributes to have when deploying many forest inventory, growth and yield models.

02.jpg


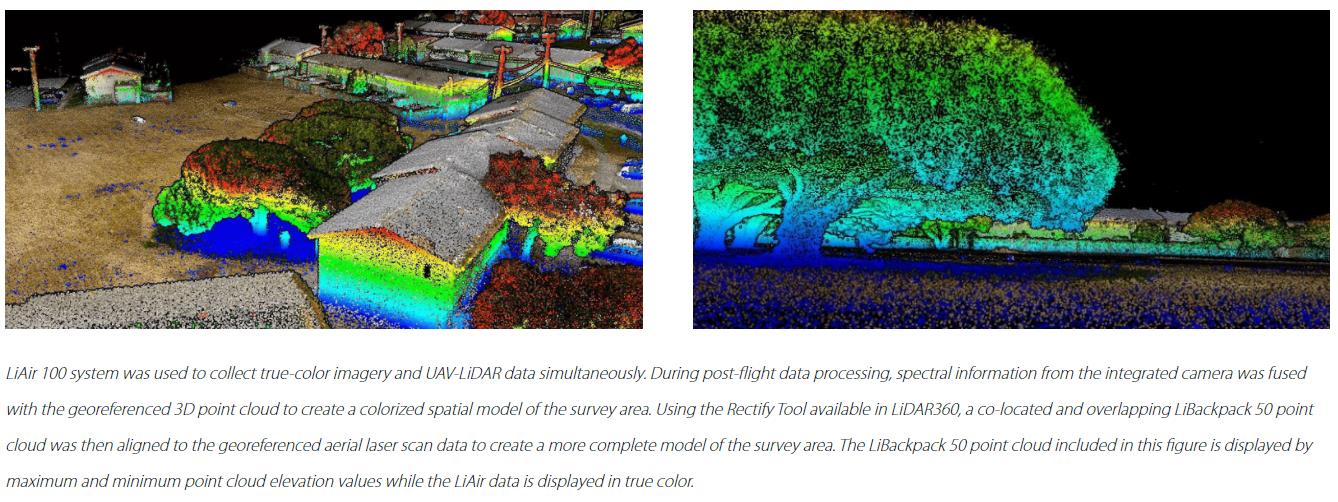
As a second example of a challenge created by the presence of data holes in 3D point cloud consider the typical airborne LiDAR dataset where the outer walls of structures are absent.  The lack of information on building facades can render these data sets to be of low use during the generation of BIM objects for AEC applications or the generation of HD base maps for autonomous vehicles. UAV- mounted LiDAR systems partially over come the limitations that traditional fixed-wing platforms faced when collecting information on building exteriors with its improved side-looking or side-scanning capabilities. However, point densities in roof-top regions of these aerial LiDAR data sets still tend to be far denser than those found in areas representing vertically oriented facets of structures that a low to the ground (e.g. single-story residential or commercial buildings). Which is why terrestrial mobile laser scanning systems can offer point clouds that are complementary to aerial LiDAR datasets in that they help to provide a more complete spatial characterization of buildings.


03.jpg


Filling Data Gaps with LiDAR360


In many instances it is possible to resolve data hole-related issues by aligning LiDAR point clouds from more than one type of laser scanning platform. Data set alignment also referred to as co-registration, can be quickly carried out using GreenValley International’s LiDAR360 point cloud processing software. Two separate but spatially overlapping 3D point clouds area co-registered to the same target coordinate system using the Rectify Tool . The fitting of the individual datasets after the tool is run can be so tight that it becomes extremely difficult to identify areas where data holes exist in either of the included point clouds.


The Rectify Tool in LiDAR360 allows users pick a set of matching point pairs between two separate point clouds and then uses the X, Y, and Z directional offset values for each pair to find the transformation equation parameter settings needed to move the input data sets into alignment. Selecting the top corners of building rooflines or the extreme outer edges of utility pole cross arms to serve as alignment points can yield high quality results when the Rectify Tool is run.  Reference target spheres can also be included in the survey area and used to align overlapping point clouds. The Rectify Tool will fit spherical objects to LiDAR points representing reference spheres and their centers are then used as corresponding points during the dataset stitching process.

05.jpg

06.jpg


When separate but overlapping point clouds are aligned some residual distance, or error, will remain between points that represent the exact same real-world location and object. The amount of space remaining between point clouds after they have been stitched together, which can be thought of as a 3D seam covering the entire region of overlap, represents error in the fit and should be minimized. Single and multi-dimensional error terms for each of the point pairs are reported in a tabular form that is displayed directly the Rectify Tool’s user interface. The user can also toggle individual point pairs on or off to find the combination of pairs that produces the lowest amount of error and generates the transformational equation that generates the best possible fit between the input datasets.


07.jpg


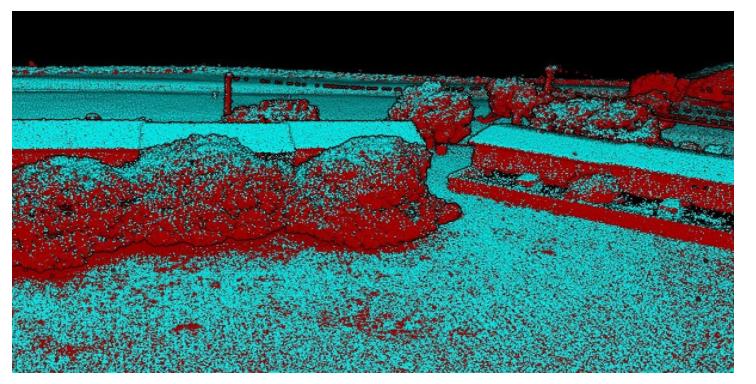
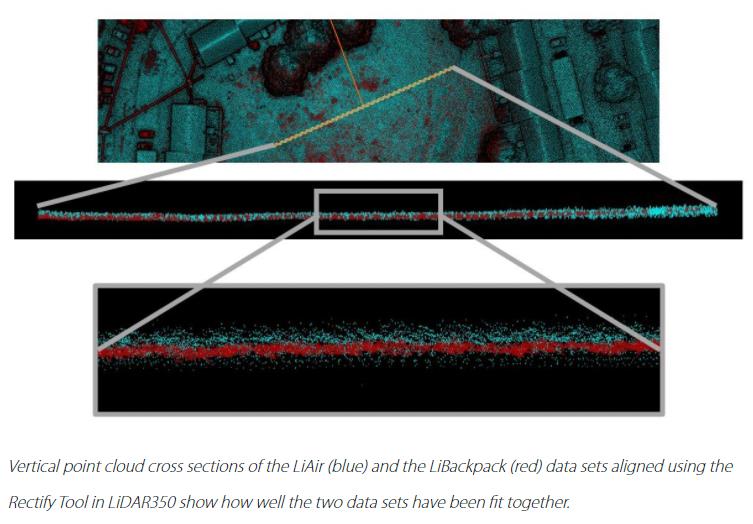
Tabulated error reports help to satisfy the quantitative aspects of quality assessment and quality control (QA/QC) reporting. But for many the proof is in the pudding, and a simple visual inspection of aligned point clouds can be enough to convince professionals of a job well-done.  Horizontal cross-sections can be generated using the Profile Tool in LiDAR360 and they allow users to quickly assess how well two separate and spatially overlapping point clouds have been “stitched” together during the alignment process carried out using the Rectify Tool.

08.jpg


With as few as just three pairs of matching or colocated points LiDAR360’s Rectify Tool will calculate the transformation parameter settings required to accurately “stitch” two separate but spatially overlapping datasets together. This versatile tool can also be used fuse images to point clouds or align images to other images. LiDAR360’s straight forward user interface allows users to easily identify stitching points or target spheres during the alignment process and inspect the quality of the resultant fit between input datasets.  To find out more about how you can suffer from LiDAR point cloud data holes no more, please contact GreenValley International by emailing info@greenvalleyintl.com today!
09.jpg

Recommended Articles

HOW CAN WE HELP YOU?
Message us your questions and contact information.
We’ll get back to you right away!