Exercise 5. Display Effects
LiDAR360 allows users to visualize data with display effects applied.
5.1 Display Modes
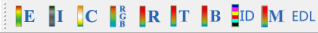
LiDAR360 supports the following display modes: By Height, By Intensity, By Classification, By RGB, By Return, By Time, By Blend, By TreeID, By Mix, and By EDL. Use the corresponding buttons to switch between display modes.
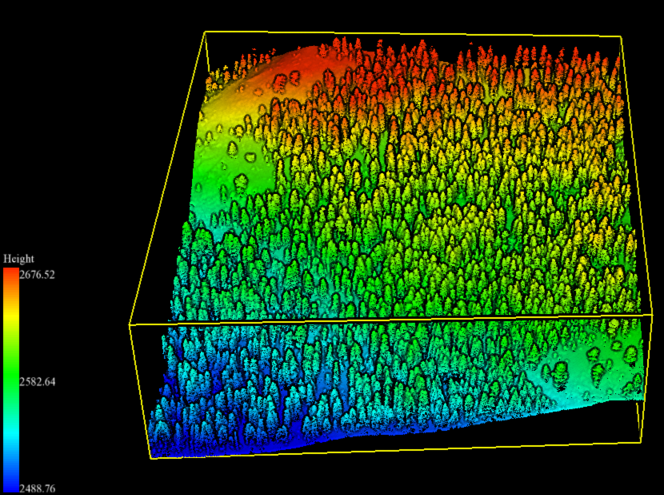
Display by Height and by Intensity:
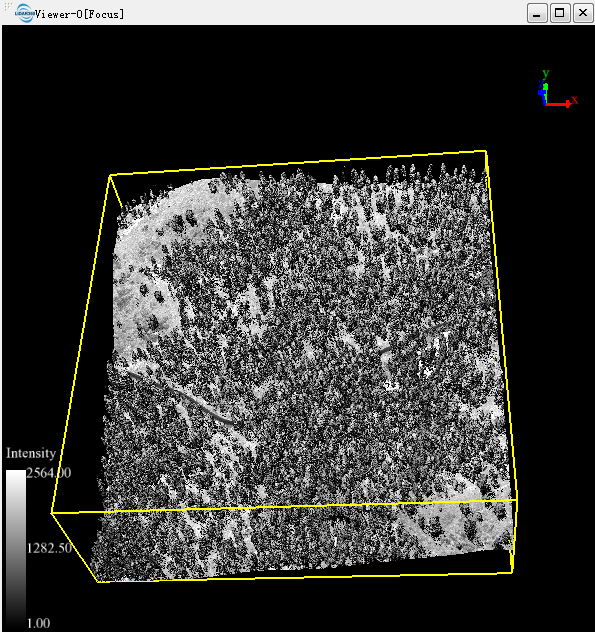
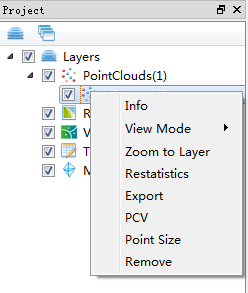
If intensity value does not exist for point cloud, right click on the data layer and select PCV Rendering to calculate a pseudo-intensity value.
5.2 Change Point Size
Right click on a data layer, then go to Point Size to change the point size in display.
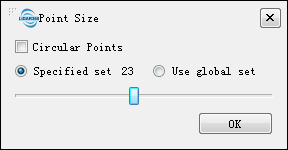
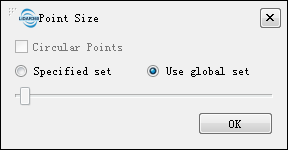
Switch to Specified Set to enable the sliding bar, slide to size 23 and then check Circular Points box to see the changes take effect in the point cloud rendered in the View window.
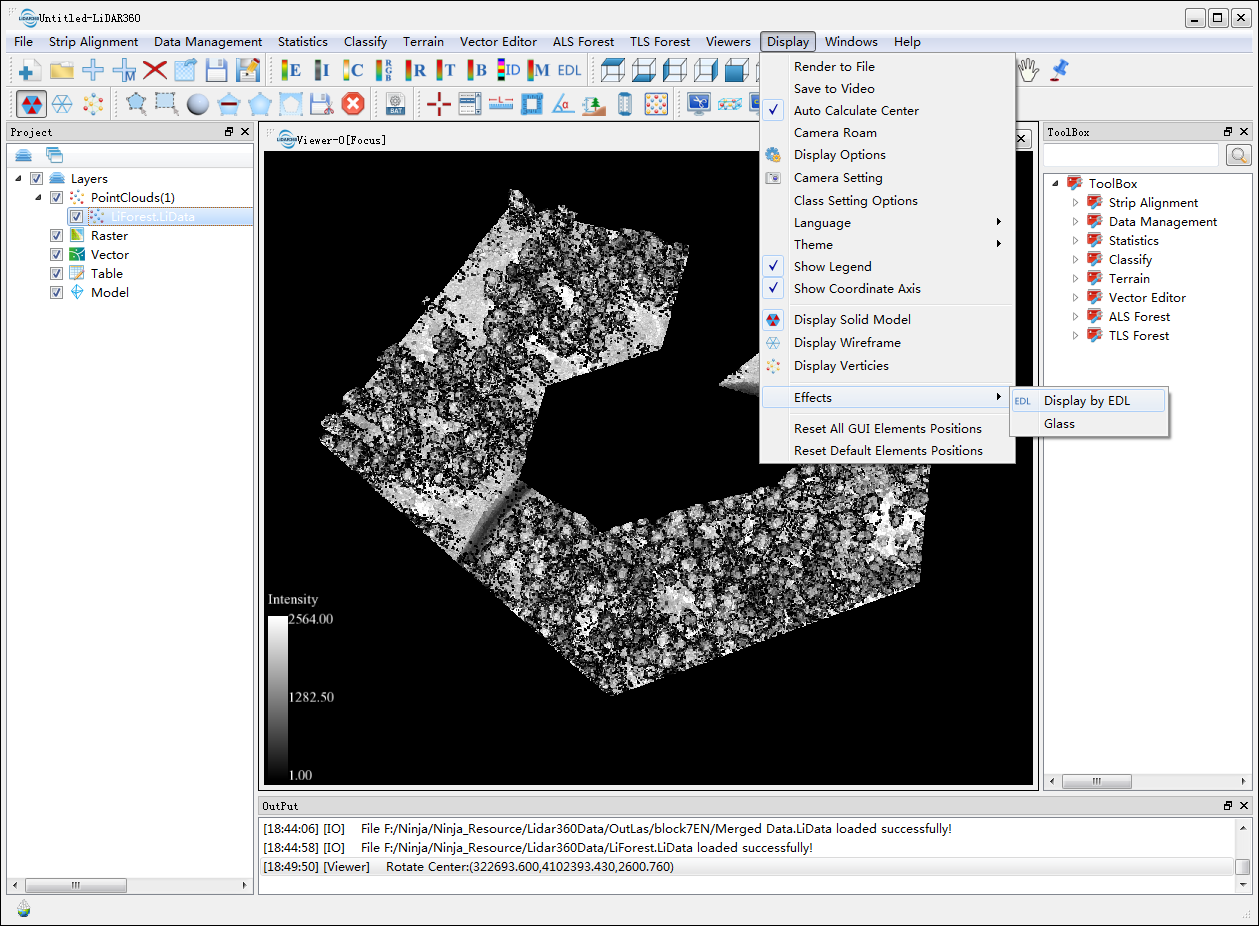
5.3 EDL and Glass Effects
Click on the EDL button ![]() on the toolbar to enable EDL display effect. You can also turn on EDL and Glass effects by going to Display > Effects > Display by EDL and Glass.
on the toolbar to enable EDL display effect. You can also turn on EDL and Glass effects by going to Display > Effects > Display by EDL and Glass.
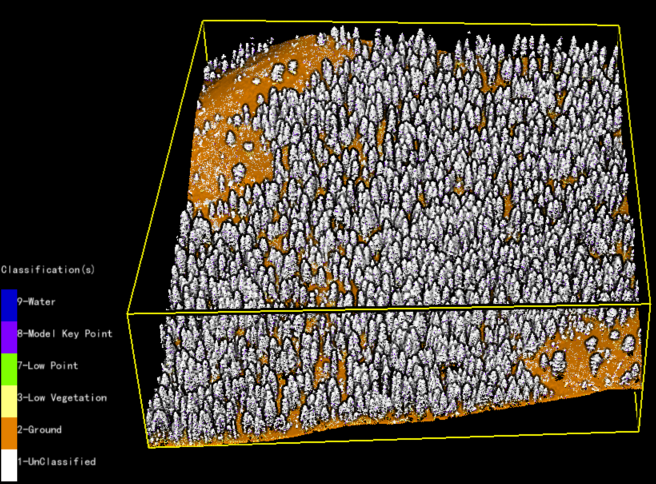
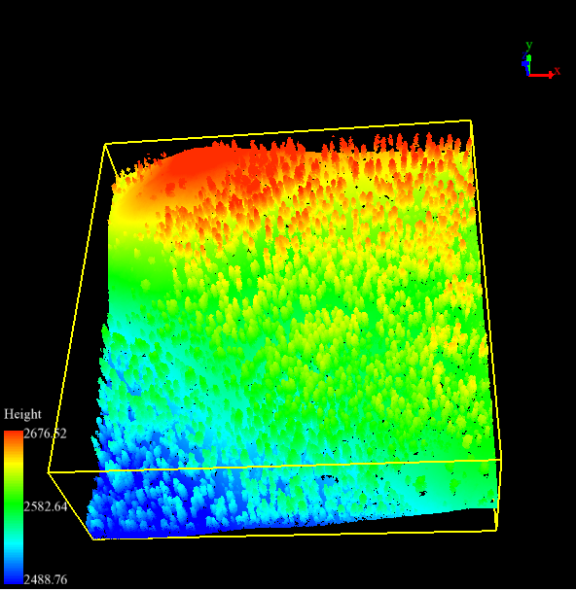
EDL effects on Display by Height and Display by Classification: